
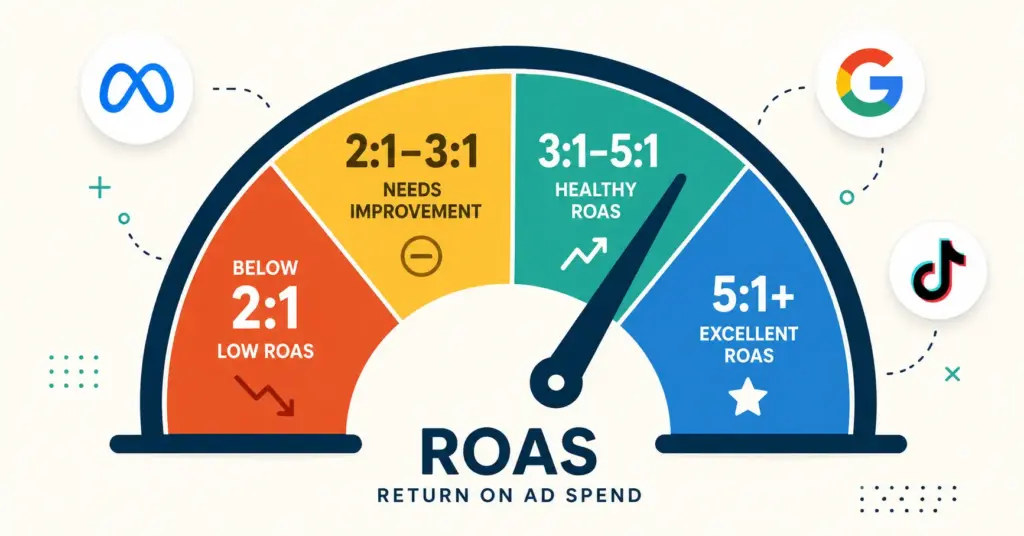
- ROAS (Return on Ad Spend) measures revenue generated per dollar of advertising spent. A 4:1 ROAS means $4 revenue for every $1 in ad spend. Average ecommerce ROAS across all channels runs 3:1 to 5:1, but benchmarks vary dramatically by channel, product category, price point, and growth stage.
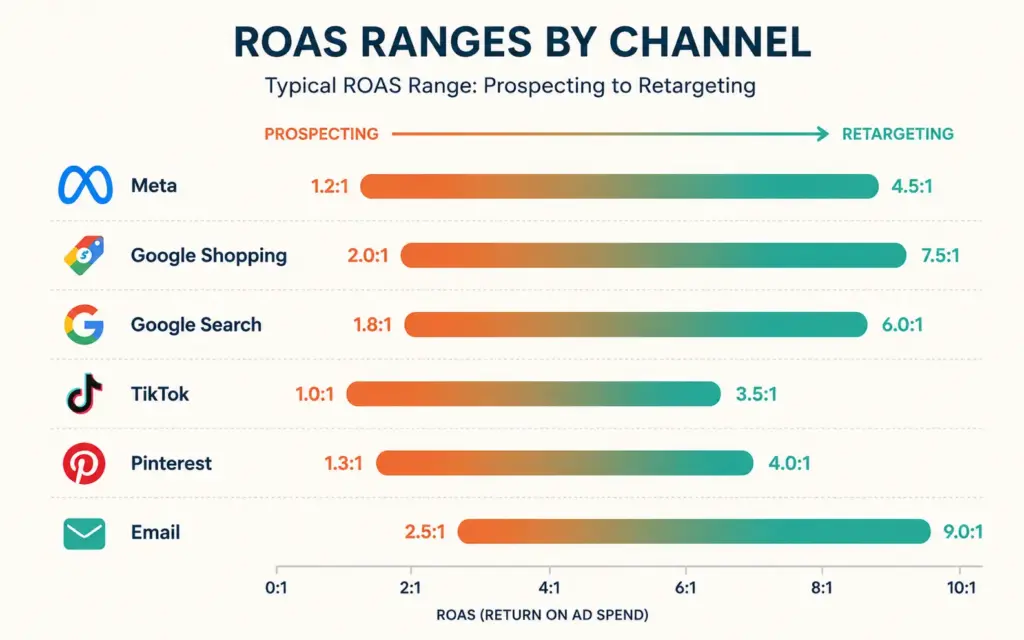
- Channel benchmarks for 2026: Meta Ads 3:1 to 5:1 (prospecting) and 8:1 to 15:1 (retargeting), Google Shopping 4:1 to 8:1, Google Search 3:1 to 6:1, TikTok Ads 2:1 to 4:1, and email/SMS 30:1 to 50:1. ROAS decreases as spend increases due to audience saturation.
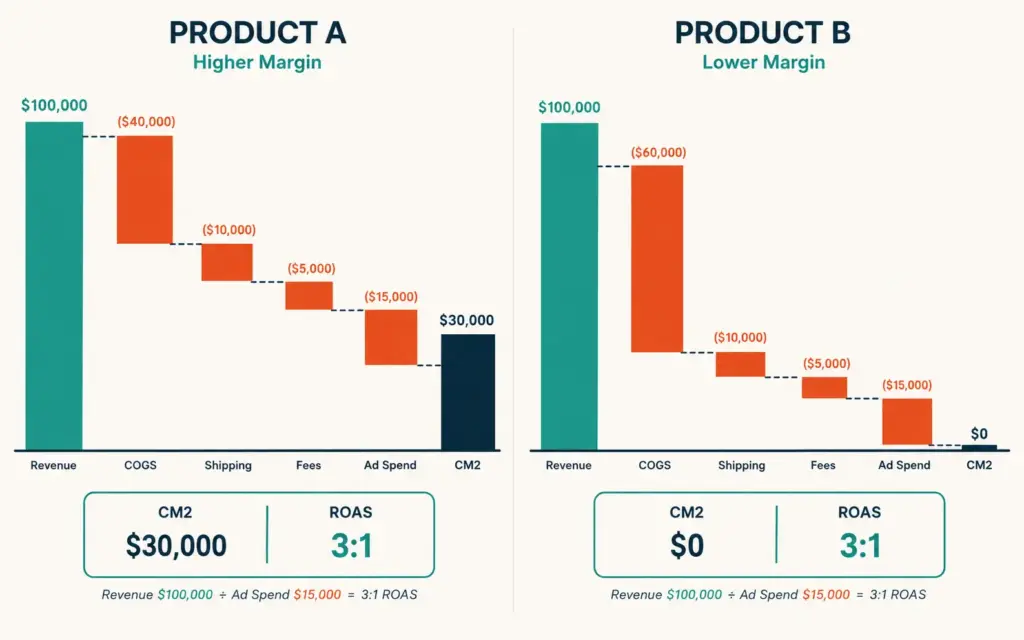
- ROAS alone is misleading without margin context. A 4:1 ROAS is profitable at 50% gross margin ($2 profit per $1 spent) but unprofitable at 25% margin ($1 gross profit per $1 spent = breakeven before operating costs).
- The metric that matters more than ROAS is contribution margin after ad spend (CM2). CM2 tells you how much profit each ad dollar generates after product cost, shipping, fees, AND ad spend are deducted.
ROAS benchmarks give ecommerce brands a reference point for evaluating whether their advertising performance is competitive, underperforming, or exceptional. ROAS (Return on Ad Spend) is calculated as revenue divided by ad spend: a $10,000 campaign generating $40,000 in revenue produces a 4:1 ROAS. The challenge is that “good” ROAS depends entirely on your gross margin, product category, ad channel, spend level, and growth stage. A 3:1 ROAS is excellent for a high-margin DTC skincare brand and disastrous for a low-margin electronics reseller. According to WordStream’s advertising benchmark data, average ecommerce ROAS across all channels and categories runs 3:1 to 5:1, but the range spans from below 1:1 to above 15:1 depending on context.
This guide breaks down ROAS benchmarks by channel, category, and spend level so you can set realistic targets, identify underperforming campaigns, and understand when ROAS alone isn’t telling you the full profitability story. For the attribution methodology behind ROAS measurement, see our attribution modeling guide.
What ROAS Should I Target by Channel?
Each advertising channel has different ROAS expectations because they reach buyers at different intent levels:
| Channel | Prospecting ROAS | Retargeting ROAS | Blended ROAS |
|---|---|---|---|
| Meta Ads (Facebook/Instagram) | 2.5:1 to 5:1 | 8:1 to 15:1 | 3:1 to 6:1 |
| Google Shopping / PMax | 3:1 to 6:1 | 6:1 to 12:1 | 4:1 to 8:1 |
| Google Search (non-brand) | 2:1 to 5:1 | N/A | 3:1 to 6:1 |
| Google Search (brand) | N/A | N/A | 15:1 to 50:1 |
| TikTok Ads | 1.5:1 to 3:1 | 5:1 to 10:1 | 2:1 to 4:1 |
| Pinterest Ads | 2:1 to 4:1 | 6:1 to 10:1 | 3:1 to 5:1 |
| Email / SMS | N/A | N/A | 30:1 to 50:1 |
Why Google brand search ROAS is misleading
Google brand search (bidding on your own brand name) shows 15:1 to 50:1 ROAS, making it look like your best-performing channel. But most brand searchers would have found your site through organic search anyway. The incremental value of brand search ads is near zero for most ecommerce stores. Including brand search ROAS in your blended numbers inflates perceived performance and masks underperforming prospecting campaigns. For incrementality testing that reveals true channel value, see our attribution modeling guide.
Why TikTok ROAS appears lower
TikTok’s in-platform ROAS typically runs 30 to 50% lower than Meta’s because TikTok-influenced purchases often complete on Google. A user sees a product on TikTok, searches the brand name on Google, and buys on your website. Google gets the attribution; TikTok gets nothing. Measure TikTok impact through branded search lift (Google Trends) alongside in-platform ROAS. For TikTok-specific strategy, see our TikTok marketing guide.
What ROAS Should I Target by Product Category?
| Category | Avg Gross Margin | Minimum Viable ROAS | Target ROAS | Strong ROAS |
|---|---|---|---|---|
| Beauty / Skincare | 60 to 75% | 1.5:1 | 3:1 to 5:1 | 6:1+ |
| Supplements / Health | 55 to 70% | 1.5:1 | 3:1 to 5:1 | 6:1+ |
| Fashion / Apparel | 50 to 65% | 2:1 | 3:1 to 5:1 | 5:1+ |
| Home / Kitchen | 45 to 60% | 2:1 | 3:1 to 5:1 | 5:1+ |
| Pet Products | 50 to 65% | 2:1 | 3:1 to 4:1 | 5:1+ |
| Electronics / Tech | 25 to 40% | 3:1 | 4:1 to 7:1 | 8:1+ |
| Food / Beverages | 40 to 55% | 2.5:1 | 3:1 to 5:1 | 6:1+ |
| Jewelry / Accessories | 55 to 75% | 1.5:1 | 3:1 to 5:1 | 6:1+ |
Minimum viable ROAS is the floor where ad spend covers product cost and ad cost but produces zero profit after operating expenses. Target ROAS is where the business generates healthy profit. Strong ROAS indicates either exceptional creative, strong brand recognition, or a product with competitive advantages that support premium pricing. For product-level margin analysis, use our profit margin calculator.
How Does ROAS Change as I Scale Spend?
ROAS almost always decreases as ad spend increases. This is normal and expected:
| Daily Ad Spend | Typical Meta ROAS Range | Why |
|---|---|---|
| $30 to $100/day | 4:1 to 7:1 | Small audience, highly targeted, low competition within your niche |
| $100 to $300/day | 3:1 to 5:1 | Algorithm expands to broader audiences, some less efficient |
| $300 to $1,000/day | 2.5:1 to 4:1 | Reaching diminishing returns on core audiences, creative fatigue faster |
| $1,000+/day | 2:1 to 3:1 | Broad reach, high frequency, saturating addressable market |
A brand with 5:1 ROAS at $50/day should not expect 5:1 at $500/day. The realistic target at $500/day might be 3:1 to 3.5:1. The question isn’t “can I maintain ROAS?” but “is the lower ROAS still profitable given my margins?” At 50% gross margin, 3:1 ROAS still generates $0.50 profit per $1 ad spend. Scale until ROAS hits your minimum viable threshold, then optimize creative and conversion rate to push the ceiling higher. Data from Varos advertising benchmarks shows median ecommerce ROAS decreased 12% year-over-year as competition increased, making creative quality and conversion rate optimization even more critical. For scaling strategy, see our Facebook ads ecommerce guide.
Why Is ROAS Alone a Misleading Metric?
ROAS ignores margin
A 4:1 ROAS on a product with 60% gross margin produces $1.40 profit per $1 ad spend (excellent). The same 4:1 ROAS on a product with 25% gross margin produces $0.00 profit per $1 spent (breakeven before operating costs). ROAS is a revenue metric, not a profit metric. Always evaluate ROAS in the context of gross margin.
The metric that matters more: CM2
Contribution Margin 2 (CM2) = Revenue – Product Cost – Shipping – Fees – Ad Spend. CM2 tells you the actual profit generated per dollar of ad spend after all variable costs.
Example comparison:
| Metric | Product A | Product B |
|---|---|---|
| Selling price | $60 | $120 |
| COGS + shipping + fees | ($24) | ($72) |
| Gross margin | $36 (60%) | $48 (40%) |
| Ad spend per sale (at 3:1 ROAS) | ($20) | ($40) |
| CM2 | $16 | $8 |
| CM2 % | 27% | 7% |
Product A generates 2x the profit per sale despite a lower selling price because its margin absorbs the ad spend more efficiently. ROAS is identical (3:1) for both products, but CM2 reveals Product A is the better scaling candidate. For deeper unit economics, see our ecommerce profit margins guide.
How Do I Calculate My Minimum Viable ROAS?
Your minimum viable ROAS is the floor where ad spend is covered by gross profit, leaving zero contribution to operating costs. Below this number, every ad dollar loses money.
The formula
Minimum Viable ROAS = 1 / Gross Margin %
- 60% margin: 1 / 0.60 = 1.67:1 minimum ROAS
- 50% margin: 1 / 0.50 = 2.0:1 minimum ROAS
- 40% margin: 1 / 0.40 = 2.5:1 minimum ROAS
- 30% margin: 1 / 0.30 = 3.3:1 minimum ROAS
- 20% margin: 1 / 0.20 = 5.0:1 minimum ROAS
Your target ROAS should be 1.5 to 2x the minimum viable ROAS to cover operating costs and generate profit. At 50% margin, minimum is 2:1, so target 3:1 to 4:1. At 30% margin, minimum is 3.3:1, so target 5:1 to 6.5:1. For CAC perspective on the same economics, see our customer acquisition cost guide.
How Do I Improve ROAS Without Cutting Spend?
1. Improve conversion rate
Double your conversion rate from 2% to 4% and ROAS doubles automatically. Same traffic, same spend, twice the revenue. Conversion rate optimization is the most direct ROAS lever because it makes every click more valuable. For CRO tactics, see our checkout optimization guide and product page design guide.
2. Improve average order value
ROAS measures revenue per ad dollar. Higher AOV means more revenue per conversion. Free shipping thresholds, product bundles, upsells, and cross-sells lift AOV 10 to 25% without additional ad spend. For AOV tactics, see our upsell and cross-sell guide.
3. Refresh creative
Ad creative fatigue is the most common cause of declining ROAS. Producing 10 to 20 new creative variations monthly prevents fatigue-driven CPA increases. Better creative can lift ROAS 30 to 50% at the same spend level. For creative production, see our ad creative tips guide.
4. Improve retargeting efficiency
Retargeting audiences convert at 3 to 5x the rate of prospecting. Allocating 15 to 25% of budget to retargeting with proper segmentation (cart abandoners, product viewers, time-based windows) lifts blended ROAS by concentrating spend on high-intent visitors. For retargeting depth, see our retargeting strategies guide.
5. Fix tracking gaps
Missing 30 to 50% of conversion data due to iOS restrictions and ad blockers means your reported ROAS is understated AND your algorithms optimize poorly. Server-side tracking (Meta CAPI, Google Enhanced Conversions) recovers lost data, improving both reported ROAS accuracy and actual campaign performance. For tracking setup, see our tracking setup guide.
How Should I Report ROAS to Stakeholders?
The ROAS reporting framework
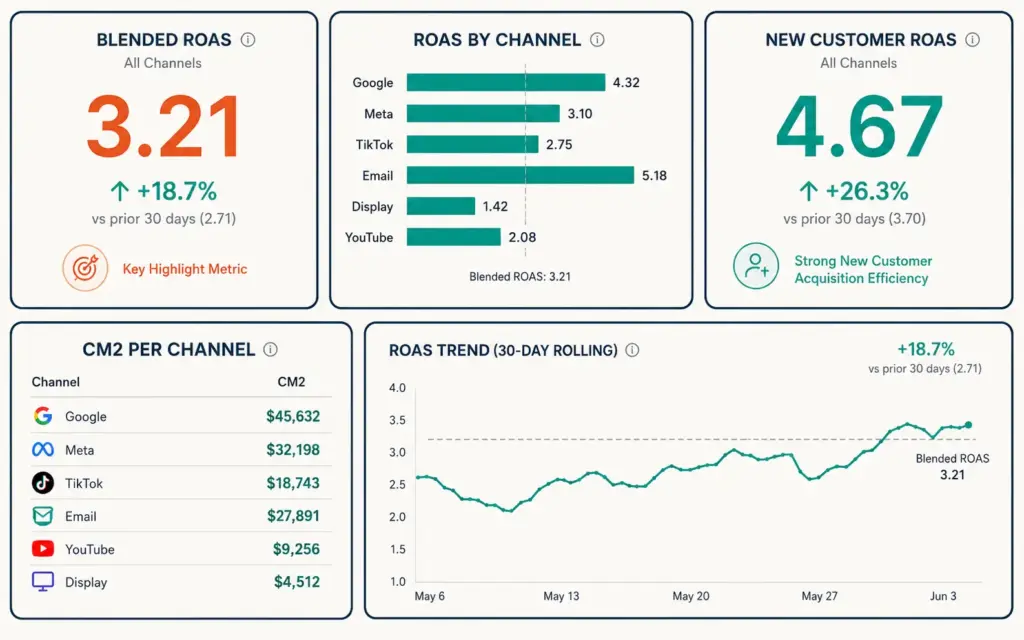
- Blended ROAS: Total revenue / total ad spend across all channels. The top-level health metric.
- Channel ROAS: Per-channel breakdown excluding brand search. Shows where money works hardest.
- New customer ROAS: Revenue from first-time buyers / ad spend. Isolates acquisition efficiency from repeat-purchase inflation.
- CM2 per channel: Profit after all variable costs including ad spend. The actual profitability metric.
- ROAS trend (rolling 30-day): Direction matters more than any single day. Rising ROAS with stable spend indicates improving efficiency.
Report monthly with 30-day rolling context. Never report a single day’s ROAS as representative. Daily ROAS fluctuates 30 to 50% from natural variance. For the full analytics framework, see our ecommerce KPIs guide.
Frequently Asked Questions
Average ecommerce ROAS runs 3:1 to 5:1 blended across all channels. “Good” depends on your gross margin: at 60% margin, 2.5:1 is profitable; at 30% margin, you need 5:1+ to break even. Meta Ads typically deliver 3:1 to 6:1 blended, Google Shopping 4:1 to 8:1, and TikTok 2:1 to 4:1. ROAS always decreases as spend increases, so set targets based on your current spend level, not aspirational budgets.
ROAS = Revenue generated from ads / Ad spend. A campaign spending $5,000 that generates $20,000 in revenue has a 4:1 ROAS. Calculate per channel (Meta ROAS, Google ROAS) and blended (total revenue / total ad spend). Always exclude brand search from blended calculations for an honest view of acquisition efficiency, since brand search ROAS is inflated by customers who would have purchased anyway.
At low spend, algorithms target the most likely buyers in your audience, producing high ROAS. As spend increases, the algorithm reaches broader, less-intent audiences to use the additional budget. This is normal and expected. ROAS at $50/day is typically 30 to 50% higher than ROAS at $500/day. The question isn’t maintaining ROAS but whether the lower ROAS is still profitable given your margins. Scale until ROAS hits your minimum viable threshold.
ROAS measures revenue per ad dollar spent (revenue / ad spend). ROI measures profit per total investment ((profit – investment) / investment x 100%). A 4:1 ROAS means $4 revenue per $1 ad spend. The ROI on that same campaign depends on margin: at 50% margin, ROI is 100% ($2 profit – $1 cost = $1 net / $1 cost). ROAS is easier to calculate in real-time; ROI is more accurate for true profitability but requires margin data per sale.
Five tactics: improve site conversion rate (doubles ROAS at same spend), refresh ad creative (prevents fatigue-driven CPA increases), increase AOV through bundles and upsells (more revenue per conversion), optimize retargeting (concentrate spend on high-intent visitors), and fix tracking gaps (server-side tracking improves algorithm optimization). Conversion rate improvement produces the fastest ROAS lift because it makes every existing click more valuable.
Minimum viable ROAS is the floor where gross profit from ad-driven sales exactly covers the ad spend, leaving zero contribution to operating costs. Formula: 1 / gross margin percentage. At 50% margin: 2:1 minimum. At 40% margin: 2.5:1. At 30% margin: 3.3:1. Below minimum viable ROAS, every ad dollar loses money. Your target should be 1.5 to 2x the minimum to cover operating costs and generate actual profit.
Related Reads
- Attribution Modeling
- Customer Acquisition Cost
- Ecommerce KPIs Guide
- Tracking Setup Guide
- Facebook Ads for Ecommerce
- Retargeting Strategies
Enjoying this? Get more like it every week.
One email per week with ecommerce strategies, tool picks, and seller insights. No spam.