- Ecommerce profit margins vary significantly by category. Average gross margins across ecommerce range 30-50%, while net margins (after all expenses) typically run 5-15%. Your specific category matters: beauty products and accessories achieve higher margins than electronics or groceries.
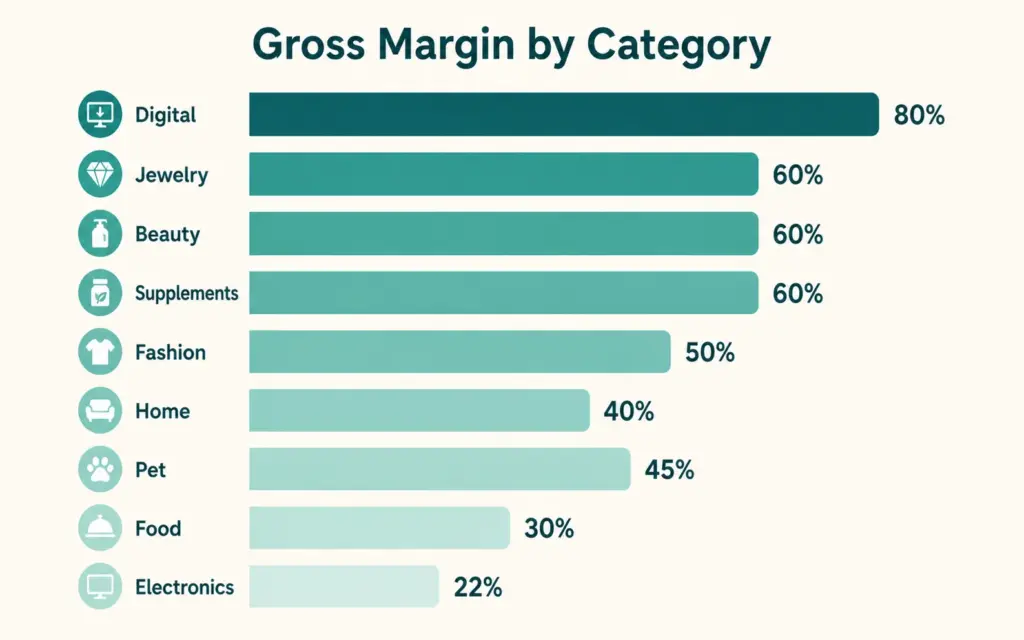
- Industry benchmarks for ecommerce gross margin: fashion and apparel 40-60%, beauty and cosmetics 50-70%, electronics 15-30%, home goods 30-50%, food and beverage 20-40%, health supplements 50-70%, jewelry 50-70%. Net margins are typically 20-40% of gross margin depending on scale and efficiency.
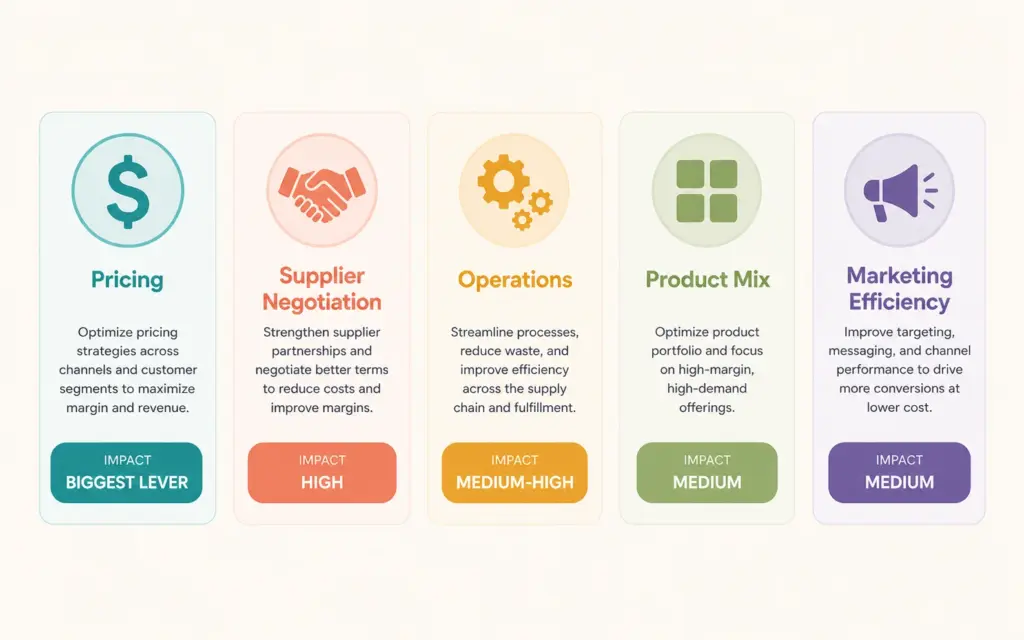
- Profit margin improvement comes from: pricing optimization (biggest driver), supplier negotiation (direct margin impact), efficient operations (reducing costs), high-margin product mix shifts (emphasizing better-margin SKUs), and scale economies (fixed costs spread over larger revenue).
- Don't chase revenue growth at the expense of profit margins. A $1M revenue business with 20% net margin ($200K profit) is healthier than a $3M revenue business with 5% net margin ($150K profit). Margin discipline enables reinvestment and sustainable scaling.
Ecommerce profit margins are the percentage of revenue remaining after costs, measured at multiple levels: gross margin (revenue minus cost of goods sold), contribution margin (gross profit minus variable operational costs like shipping and payment processing), and net margin (bottom line after all expenses including marketing, team, and overhead). Understanding profit margins by category gives you crucial context for evaluating your business performance and identifying opportunities for improvement.
Generic ecommerce margin advice is almost always misleading because averages hide massive variation between categories. A 25% gross margin is catastrophic for jewelry (where 60%+ is typical) but healthy for electronics (where 20-30% is normal). A 10% net margin is exceptional for discount retailers but mediocre for beauty brands. Context matters enormously.
This guide covers industry-specific margin benchmarks, how to calculate different margin metrics, and systematic approaches to improve ecommerce profitability. For the financial planning that builds on margin data, see our financial planning guide.
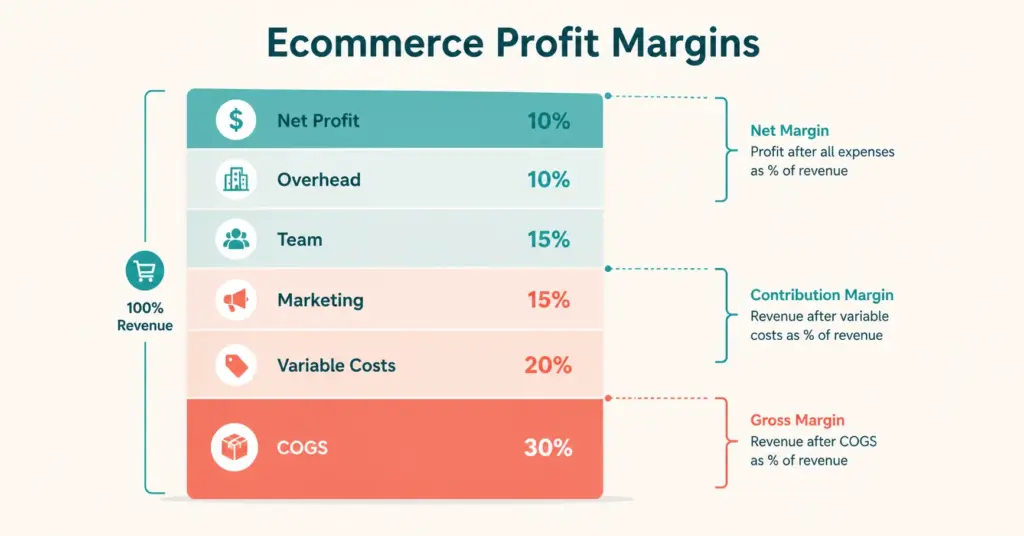
The Three Margin Metrics That Matter
Gross Margin
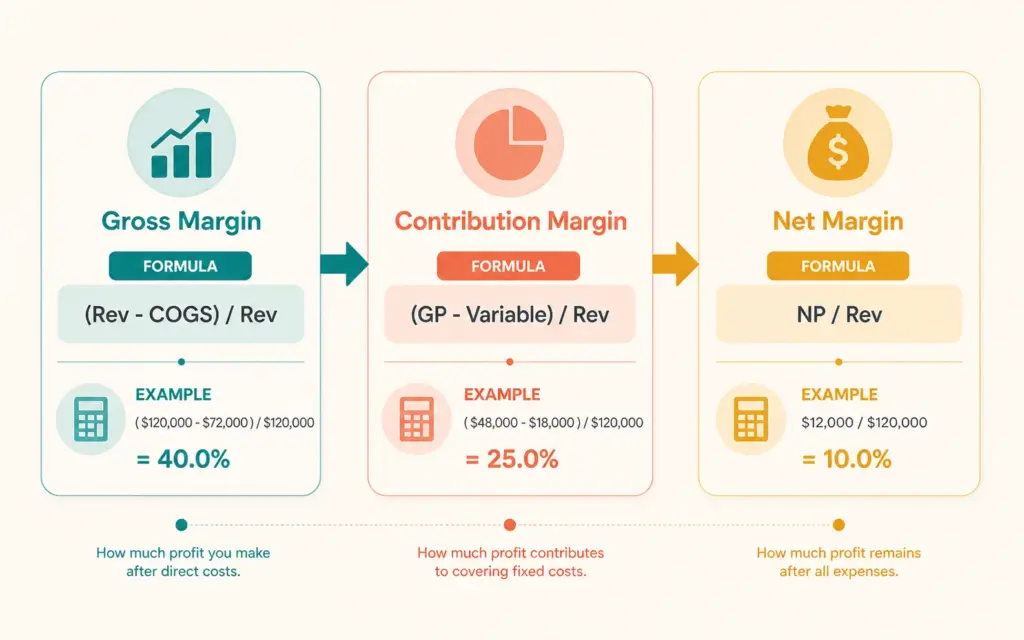
Formula: (Revenue minus Cost of Goods Sold) divided by Revenue × 100
Gross margin measures how much of your revenue remains after paying for the products you sold. It’s the foundational metric because it sets the ceiling for all other profitability. A store with 30% gross margin cannot achieve 40% net margin regardless of operational efficiency.
Good gross margin targets by scale:
- Mass market/commodity products: 25-35%
- Typical ecommerce: 35-50%
- Premium brands: 50-70%
- Luxury or niche specialty: 70%+
Contribution Margin
Formula: (Gross Profit minus Variable Costs per Order) divided by Revenue × 100
Variable costs scale with each order: shipping, payment processing fees (2.9% + $0.30 typical for Stripe), marketplace fees (15% for Amazon), ad attribution costs. Contribution margin shows what’s actually left after an order’s variable costs, before fixed costs like rent, team, software.
Typical contribution margins: 20-40% of revenue, meaning each order contributes $20-40 per $100 in revenue toward covering fixed costs and generating profit.
Net Margin
Formula: Net Profit divided by Revenue × 100
Net margin is your bottom line after everything: COGS, shipping, payment processing, marketing, team salaries, software, office, insurance, taxes. It’s what ends up in your pocket (or reinvested in the business).
Typical net margins for ecommerce:
- Struggling or commodity: 0-5%
- Typical/average: 5-12%
- Strong performers: 12-20%
- Exceptional: 20%+
Industry Profit Margin Benchmarks
Average margins by category based on industry analysis (2024-2025 data):
| Category | Gross Margin | Net Margin |
|---|---|---|
| Fashion/Apparel | 40-60% | 5-12% |
| Beauty & Cosmetics | 50-70% | 10-18% |
| Electronics & Tech | 15-30% | 3-8% |
| Home Goods/Furniture | 30-50% | 5-12% |
| Food & Beverage | 20-40% | 3-8% |
| Health & Wellness/Supplements | 50-70% | 8-15% |
| Jewelry | 50-70% | 10-20% |
| Sporting Goods | 30-45% | 5-10% |
| Pet Products | 35-55% | 6-12% |
| Baby/Kids Products | 35-55% | 6-12% |
| Auto Parts/Accessories | 25-40% | 4-10% |
| Books/Media | 15-35% | 3-7% |
| Digital Products/Software | 70-90% | 20-40% |
| Handmade/Craft | 50-70% | 10-20% |
Why the wide variation? Factors include competitive intensity, typical product costs, perceived value, sourcing options, and whether category sellers can differentiate or compete purely on price. Digital products have the highest margins because variable cost per unit is near-zero. Electronics have the lowest because components are commodities with thin manufacturer margins.
Why Margins Vary by Channel
The same product sold through different channels generates different net margins:
| Channel | Typical Fee Structure | Margin Impact |
|---|---|---|
| Shopify (your store) | Platform fee 2-5%, payment processing 2.9%+$0.30 | Highest margin |
| Amazon FBA | Referral fee 8-15%, FBA fee ~$3-6 per item | Lower margin (Amazon keeps 30-40% total) |
| eBay | Final value fee 12.55% + $0.30 | Similar to Amazon, lower margin |
| Etsy | Transaction fee 6.5%, payment processing ~3%, listing fees | Middle ground |
| Walmart Marketplace | Referral fee 6-15% | Similar to Amazon |
| Wholesale/B2B | Negotiated terms, higher volumes | Lower per-unit margin, higher volume |
This is why store owners often earn more from $1M in Shopify revenue than $2M in Amazon revenue. Channel economics matter enormously.
Our Amazon FBA guide and multi-channel strategy guide cover channel economics in depth.
How to Improve Ecommerce Profit Margins
Strategy 1: Pricing Optimization (Biggest Driver)
Price changes provide the biggest immediate margin impact. A 10% price increase with no COGS change drops straight to gross profit. Most ecommerce stores under-price because they fear losing customers, but many products have more pricing elasticity than owners assume.
- Test higher prices on less-visible products first to understand elasticity
- Reduce discounting frequency (customers learn to wait for sales)
- Implement strategic tiered pricing (basic, standard, premium versions)
- Bundle products to increase average order value and perceived value
- Price psychology: $29 beats $30 psychologically even if rational logic disagrees
Our pricing strategy guide covers pricing frameworks in detail.
Strategy 2: Supplier Negotiation
Direct COGS improvements flow straight to gross margin. Approaches:
- Volume commitments: Committing to 6-12 months of orders in advance often unlocks 10-20% discounts
- Annual supplier reviews: Renegotiate terms yearly based on volume history
- Alternative supplier quotes: Getting competing quotes gives you negotiating power with current supplier
- Direct factory sourcing: Buying directly from factories bypasses middleman margins, saving 15-40%
- Larger order quantities: Moving from $10,000 orders to $50,000 orders often unlocks significant per-unit discounts
Strategy 3: Operational Efficiency
Reducing variable costs improves contribution margin:
- Shipping cost optimization: Negotiate carrier rates, use shipping software, compare carriers per package (see our shipping strategies guide)
- Payment processor negotiation: Once you hit $100K+ monthly payment volume, Stripe and other processors often negotiate better rates
- Fulfillment automation: 3PLs at scale cost less than manual fulfillment (our outsourcing guide covers 3PL economics)
- Returns reduction: Better product photos, clearer descriptions, and accurate sizing reduce returns that eat margins
Strategy 4: Product Mix Shift
Not every SKU contributes equally to profits. Classic 80/20 rule applies: roughly 80% of profit comes from 20% of products. Identify your highest-margin SKUs and focus more attention (marketing, inventory, merchandising) on those.
- Product mix analysis: Rank SKUs by contribution margin
- Eliminate low-margin SKUs: Products barely contributing to profit tie up capital and attention
- Develop bundles of high-margin items: Increase AOV while shifting mix toward profitable products
- Launch premium tiers: A $79 premium version of a $29 standard often has 3-5x better margin
Strategy 5: Marketing Efficiency
Marketing spend is usually the largest discretionary expense in ecommerce. Improving marketing ROI protects and grows margins:
- Improve ad creative: Better creative directly lowers CAC
- Expand email marketing: Email typically delivers 20-40x ROAS vs paid ads
- Increase customer retention: Existing customers cost 5-25x less to sell to than new ones
- Focus on highest-margin channels: Shift budget from low-converting to high-converting channels
- Build organic traffic: SEO and content marketing reduce reliance on expensive paid channels (see our SEO guide)
Scale and Margin Relationship
Ecommerce margins typically improve with scale up to a point, then plateau or decline:
- Startup ($0-500K annual): Often unprofitable as investment phase. Negative or 0-5% margins normal.
- Growing ($500K-2M): Margins improve as efficiency grows. 5-10% net margin typical.
- Mid-market ($2M-10M): Optimal margin zone. Scale benefits without enterprise overhead. 10-20% net margin possible.
- Large ($10M-50M): Growing team and infrastructure costs often compress margins. 8-15% net margin typical.
- Enterprise ($50M+): Complexity and management layers typically mean 5-12% net margins despite revenue scale.
Mid-market is the sweet spot. Large enough to gain efficiency benefits but small enough to avoid enterprise overhead. Many sophisticated ecommerce operators optimize for staying in this range rather than pursuing maximum revenue growth.
Margin Red Flags to Watch
Several patterns indicate margin problems that compound if ignored:
Gross margin declining over time. Either COGS rose (supplier increased prices) or pricing dropped (competitive pressure or over-discounting). Diagnose root cause and address directly.
Shipping costs as percentage of revenue rising. Rising shipping rates, bigger/heavier products, or more distant customers. Explore shipping optimizations before accepting the hit.
Payment processing costs exceeding 3.5% of revenue. Either you’re on retail rates when volume qualifies for negotiated rates, or chargebacks are inflating costs.
Marketing spend rising faster than revenue. Customer acquisition is becoming less efficient. Either channels are saturating, creative is fatigued, or competitive CAC pressure is rising. Diagnose and address.
Return rates trending up. Returns kill margins through reverse logistics costs and write-offs. Investigate cause: sizing issues, product quality, misleading descriptions, or customer mismatch.
Overhead growing as percentage of revenue. Team and infrastructure costs should grow slower than revenue at healthy companies. If overhead grows faster, efficiency is declining.
Track margin trends monthly. Early identification lets you address issues before they compound. Late identification means accepting reduced profitability or making painful emergency changes.
Frequently Asked Questions
Good ecommerce profit margins vary by category. Average gross margins run 30-50%, and net margins typically run 5-15%. Category-specific benchmarks: fashion 40-60% gross and 5-12% net, beauty 50-70% gross and 10-18% net, electronics 15-30% gross and 3-8% net, home goods 30-50% gross and 5-12% net. A 10%+ net margin is solid; 15%+ is strong; 20%+ is exceptional performance.
Three key calculations: Gross Margin = (Revenue minus COGS) / Revenue × 100. Contribution Margin = (Gross Profit minus Variable Costs like shipping and payment processing) / Revenue × 100. Net Margin = Net Profit / Revenue × 100. Example: $100 revenue, $40 COGS, $10 variable costs, $30 marketing, $15 other expenses. Gross margin = 60%, contribution margin = 50%, net margin = 5%.
Typical gross margins by category: fashion and apparel 40-60%, beauty 50-70%, electronics 15-30%, home goods 30-50%, food and beverage 20-40%, supplements 50-70%, jewelry 50-70%, digital products 70-90%. Net margins are generally 20-40% of gross margin. Categories with higher competition (electronics, commodity products) have lower margins than differentiated premium categories (beauty, jewelry, handmade).
Five improvement levers: pricing optimization (test higher prices, reduce discounting, bundle products), supplier negotiation (volume commitments, alternative quotes, direct factory sourcing), operational efficiency (shipping optimization, payment processor rates, returns reduction), product mix shift (emphasize high-margin SKUs), and marketing efficiency (better creative, email marketing, customer retention, organic channels). Pricing typically delivers biggest immediate impact.
Amazon takes 30-40% of revenue in combined fees: referral fee 8-15% depending on category, FBA fulfillment fee ~$3-6 per item, storage fees, and optional advertising spend. Shopify costs roughly 5% total (2.9% + $0.30 payment processing plus $29-299/month platform fee). Same product on Shopify generates 20-30 percentage points more margin than on Amazon. This is why store owners often earn more from smaller Shopify revenues than larger Amazon revenues.
Gross margin measures revenue minus cost of goods sold only. Net margin measures revenue minus ALL expenses (COGS plus shipping, payment processing, marketing, team, software, overhead, taxes). Gross margin sets the ceiling; net margin shows bottom-line profitability. A business with 50% gross margin can have 10% net margin after all other expenses. Tracking both reveals whether operational costs are reasonable for your gross margin structure.
Related Reads
- Financial Planning for Scaling
- Ecommerce Pricing Strategy
- Amazon FBA Guide
- Shipping Strategies
- Customer Retention Strategies
- Ecommerce Accounting Tools
Enjoying this? Get more like it every week.
One email per week with ecommerce strategies, tool picks, and seller insights. No spam.