
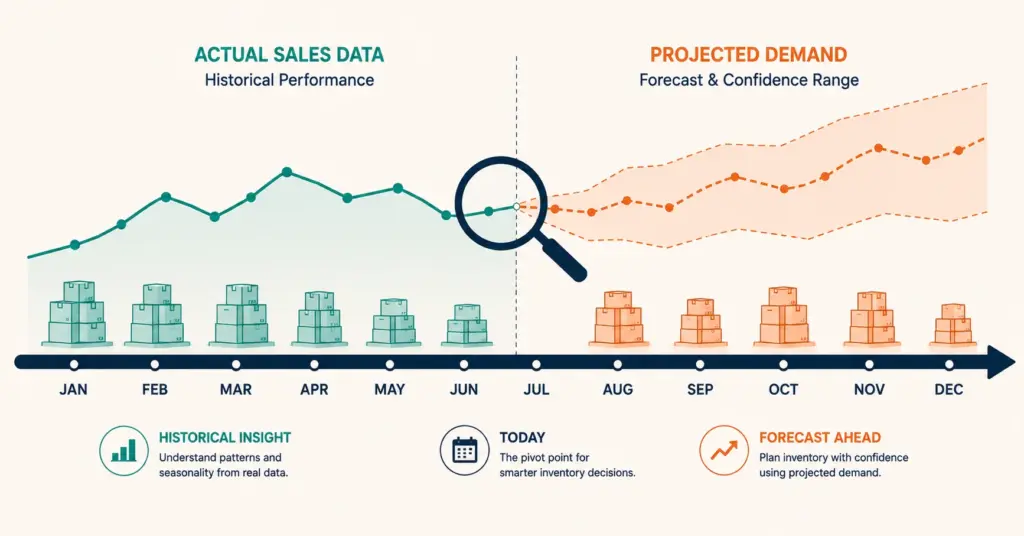
- Demand forecasting predicts how many units of each product you'll sell over a future period, which determines how much inventory to order, when to order it, and how much cash to allocate. Accurate forecasting prevents two equally costly problems: stockouts (lost revenue, lost rankings) and overstocking (tied-up cash, storage costs, eventual markdowns).
- The simplest forecasting method that works for 90% of ecommerce stores: trailing 90-day average daily sales x days of coverage needed x seasonal adjustment factor + safety stock buffer. This requires nothing more than your sales history and a spreadsheet.
- Seasonal adjustment is the factor most forecasts miss. A store selling 10 units/day in September might sell 30 units/day in November. Forecasting November inventory using September's average creates a stockout during peak revenue season. Apply seasonal multipliers from the previous year's monthly sales distribution.
- The cost of a stockout is 2 to 5x the cost of overstocking the same product. A stockout loses the sale, damages search ranking (Amazon and Google penalize unavailable products), and sends the customer to a competitor. Overstocking ties up cash and eventually requires a markdown, but the product is still sellable.
Demand forecasting for ecommerce predicts how many units of each product you’ll sell over a future period so you can order the right amount of inventory at the right time. Get it right and inventory flows smoothly: products arrive before they sell out, cash isn’t trapped in unsold stock, and customers find what they want in stock. Get it wrong in either direction and the consequences compound. Stockouts cost revenue immediately and damage marketplace rankings that take weeks to recover. Overstocking locks cash into products depreciating on a shelf. According to McKinsey’s supply chain research, companies with accurate demand forecasting carry 15 to 30% less inventory while maintaining higher in-stock rates than competitors relying on intuition.
Most ecommerce stores under $5M annual revenue don’t need machine learning or enterprise forecasting software. A spreadsheet, 6+ months of sales history, and the methods in this guide produce forecasts accurate enough to prevent 90% of stockout and overstock situations. The inventory management infrastructure implements whatever the forecast recommends; this guide produces the numbers that feed those decisions.
The Simple Forecasting Formula
For any product with 3+ months of sales history:
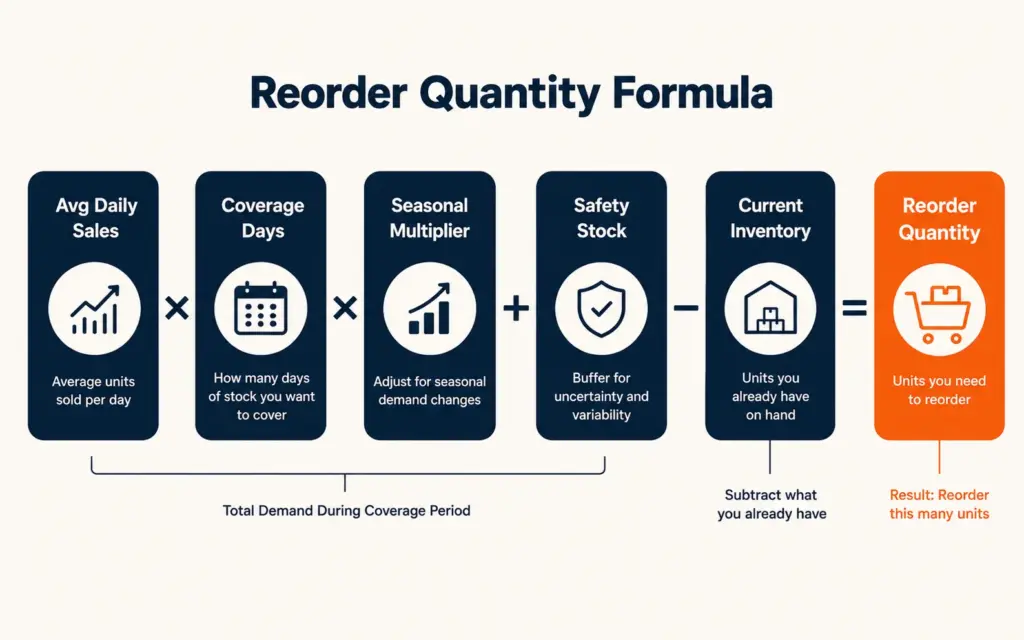
Reorder Quantity = (Avg Daily Sales x Coverage Days x Seasonal Multiplier) + Safety Stock – Current Inventory
Breaking down each component
Average daily sales: Total units sold over the past 90 days / 90. Using 90 days smooths out weekly fluctuations while remaining responsive to trends. If a product sold 270 units in the last 90 days, average daily sales = 3 units/day. Pull this directly from Shopify Analytics (Products > select product > view sales by date range) or your order data export.
Coverage days: How many days of inventory you want on hand. This should equal your supplier lead time + a buffer. If your supplier ships in 14 days and you want 30 days of safety runway, coverage days = 44. For domestic suppliers (5 to 10 day lead time), target 30 to 45 coverage days. For overseas suppliers (30 to 60 day lead time), target 60 to 90 days. The shipping strategies data on carrier and supplier lead times feeds directly into this calculation.
Seasonal multiplier: Adjusts the forecast for predictable demand patterns. If December typically sells 2.5x September volume, the multiplier for a December forecast based on September sales data is 2.5. Calculate from the previous year: (target month’s total sales / source month’s total sales). Without this adjustment, you’ll stockout during peaks and overstock during valleys.
Safety stock: Buffer inventory that protects against supplier delays, unexpected demand spikes, and forecast inaccuracy. Standard calculation: average daily sales x average lead time variance in days. If lead time varies by +/- 5 days and you sell 3 units/day, safety stock = 15 units. More aggressive growth phases warrant higher safety stock (20 to 30% of expected demand rather than the formula minimum).
Seasonal Forecasting: The Factor Most Stores Miss
Ecommerce demand is rarely flat across months. Even “non-seasonal” products typically see 30 to 50% variation between their lowest and highest months due to holiday shopping, weather patterns, back-to-school timing, and promotional events.
Building a seasonal index
- Pull monthly sales for the previous 12 months (or 24 months for better accuracy)
- Calculate the monthly average: total annual units / 12
- Divide each month’s actual units by the monthly average to get the seasonal index
Example: 12-month total = 3,600 units. Monthly average = 300. January sold 180 units: index = 0.60. November sold 540 units: index = 1.80. When forecasting November inventory using current run-rate data, multiply by 1.80. Forecasting January from November run-rate data? Multiply by 0.60 / 1.80 = 0.33.
Without seasonal adjustment, a store running at 15 units/day in October will order October-level inventory for November and stockout by Black Friday. The cash flow management approach should align for seasonal peaks should align with these forecasted demand spikes, with inventory purchasing front-loaded 60 to 90 days before peak periods.
Forecasting for New Products (No Sales History)
New products lack the historical data that feeds the standard formula. Three proxy methods fill the gap:
Comparable product analysis. Find an existing product in your catalog with similar price, category, and target customer. Use its first 90 days of sales as the forecast baseline for the new product. Adjust up or down based on marketing investment differences. If the comparable launched with $500 in ads and the new product launches with $2,000, adjust the forecast upward proportionally.
Pre-launch demand signals. If you ran a pre-launch marketing campaign, email waitlist size and pre-order quantities provide demand data. Convert 10 to 20% of waitlist subscribers as the optimistic first-month forecast. Pre-orders are the most reliable predictor because they represent committed purchases.
Small-batch validation. Order the minimum viable quantity (often 100 to 500 units from your manufacturer) and sell through it before committing to a large reorder. The sell-through rate on the first batch becomes your demand baseline. If 200 units sell in 30 days, daily demand = 6.67 units. If 200 units sell in 90 days, daily demand = 2.22 units. Scale reorder quantities from there. The best selling products research should produce demand signals before you commit large inventory purchases.
Tools for Demand Forecasting
| Tool | Best For | Method | Cost |
|---|---|---|---|
| Google Sheets / Excel | Stores under 100 SKUs | Manual formulas (above) | Free |
| Inventory Planner (Shopify) | Shopify stores, 50 to 500 SKUs | Automated forecasting + PO generation | $99+/month |
| Flieber | Multi-channel, Amazon + DTC | ML-based demand + supply planning | $350+/month |
| Cin7 / Dear Inventory | Stores needing ERP + forecasting | Demand planning within broader operations | $249+/month |
Start with the spreadsheet method. The formula above handles 90% of forecasting needs for stores with under 100 SKUs. Graduate to Inventory Planner when manual forecasting exceeds 2 to 3 hours weekly or when SKU count makes spreadsheet management impractical. The ecommerce tools and tech stack decisions should weigh forecasting tool cost against the cash value of reduced stockouts and overstocking.
Measuring Forecast Accuracy
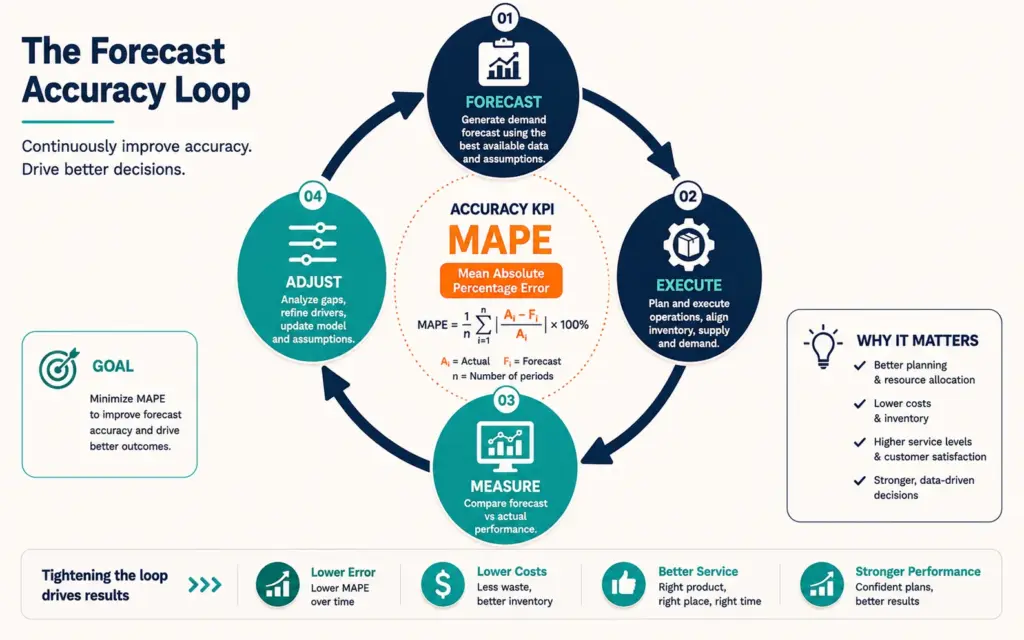
A forecast is only useful if you track whether it was right. Two accuracy metrics:
MAPE (Mean Absolute Percentage Error): Average of |Actual – Forecast| / Actual across all products. Target under 25% MAPE for most ecommerce stores. Under 15% is excellent. Above 35% means the forecast is providing minimal value over random ordering.
Stockout rate: Percentage of days any SKU was out of stock. Target under 5%. Above 10% means forecasting or reorder triggers need improvement. Track per-product because blended stockout rates hide individual product problems. The ecommerce KPIs dashboard should include stockout rate as a standard operational metric alongside revenue and conversion rate.
Review forecast accuracy monthly. Compare last month’s forecast against actual sales. Adjust the formula inputs (particularly safety stock multiplier and seasonal index) based on where the forecast over- or under-predicted. Forecasting improves through iteration, not through more sophisticated tools. According to Harvard Business Review’s supply chain analysis, the biggest forecasting improvements come from disciplined process execution, not from upgrading to AI-powered forecasting tools.
Common Demand Forecasting Mistakes
Forecasting from a single month’s data. One month of sales is too noisy: a single viral TikTok post, a competitor stockout, or a seasonal event can make one month unrepresentative. Use 90-day trailing averages minimum. 6 to 12 months of data produces significantly more reliable forecasts.
Ignoring lead time in reorder timing. Forecasting demand correctly but ordering too late produces the same result as not forecasting at all. If your supplier needs 30 days to deliver and you reorder when inventory hits 5 days of stock, you’ll be out of stock for 25 days. Reorder when current inventory equals (daily sales x lead time in days + safety stock). The 3PL guide receiving timeline considerations adds additional lead time beyond supplier shipping.
Not adjusting for marketing changes. Planning a major ad campaign that doubles traffic? The demand forecast needs to reflect the expected conversion lift. Reducing ad spend by 50%? Demand will drop proportionally. Treat marketing spend changes as demand modifiers, not ignore them. The financial planning and scaling model should align marketing budget projections with inventory purchase projections.
Equal treatment of all SKUs. Your top 20% of products generate 60 to 80% of revenue. Spend 80% of forecasting effort on these products. Low-volume SKUs can use simpler reorder point triggers (reorder when stock hits X units) rather than detailed demand modeling. Precision where it matters; simplicity where it doesn’t. The ecommerce profit margins by product determines which SKUs warrant detailed forecasting investment.
Forgetting that promotions create artificial demand spikes. A Black Friday sale that doubles unit sales doesn’t mean organic demand doubled. Using promotion-period data as the baseline for non-promotional forecasting causes massive overstocking in the following months. Separate promotional demand from organic demand in your historical data before feeding it into forecasts. The discount strategy and promotional event planning should communicate timing and expected volume impact to whoever manages inventory purchasing.
Frequently Asked Questions
Demand forecasting predicts how many units of each product you’ll sell over a future period. The prediction determines how much inventory to order, when to order it, and how much cash to allocate to inventory purchases. Accurate forecasting prevents both stockouts (lost revenue, lost rankings) and overstocking (tied-up cash, storage costs, eventual markdowns). Most stores under $5M annual revenue can forecast accurately with a spreadsheet and 6+ months of sales history.
Three proxy methods: use a comparable existing product’s first 90 days as the baseline, convert pre-launch waitlist or pre-order data into demand estimates (10 to 20% of waitlist as optimistic forecast), or order a small first batch (100 to 500 units) and use the sell-through rate to calculate daily demand. Scale reorder quantities from whichever data source you have. After 90 days of actual sales, switch to the historical formula.
Standard formula: average daily sales multiplied by average lead time variance in days. If you sell 5 units/day and lead time varies by plus or minus 7 days, safety stock = 35 units. During aggressive growth or seasonal peaks, increase to 20 to 30% of expected demand. For products with reliable suppliers (less than 3 days lead time variance), 10 to 15% of expected demand as safety stock is sufficient.
Build a seasonal index from the previous year’s monthly sales. Calculate monthly average (annual units / 12), then divide each month’s actual by the average. A month with 1.8 index sells 80% above average; a month with 0.6 index sells 40% below. Apply these multipliers to current run-rate data when forecasting future months. Without seasonal adjustment, you’ll stockout during peaks and overstock during valleys.
Start with Google Sheets or Excel using the formula in this guide. This handles 90% of forecasting needs for stores with under 100 SKUs. Graduate to Inventory Planner ($99/month on Shopify) when manual forecasting exceeds 2 to 3 hours weekly. Multi-channel sellers needing Amazon plus DTC forecasting should evaluate Flieber ($350/month). The spreadsheet method produces equally accurate results as paid tools for most small to mid-size stores.
Target under 25% MAPE (Mean Absolute Percentage Error) for most ecommerce stores. Under 15% is excellent. Above 35% means the forecast provides minimal value over intuition-based ordering. Track stockout rate alongside forecast accuracy: target under 5% of days with any SKU out of stock. Review forecast versus actual monthly and adjust inputs (seasonal multipliers, safety stock buffers) based on where predictions deviated.
Related Reads
- Inventory Management Guide
- Cash Flow Management
- Financial Planning and Scaling
- Ecommerce Profit Margins
- Best Selling Products Research
- Ecommerce KPIs
Enjoying this? Get more like it every week.
One email per week with ecommerce strategies, tool picks, and seller insights. No spam.