
- Ecommerce metrics are the quantitative measurements that track store performance across acquisition, conversion, retention, and profitability. Most stores track too many metrics and act on too few. Focus on 15 KPIs organized into four tiers.
- The five metrics that matter most for profitability are customer acquisition cost (CAC), customer lifetime value (LTV), LTV:CAC ratio (target 3:1 or higher), contribution margin per order, and blended return on ad spend (ROAS).
- Conversion rate alone is misleading without context. A store converting at 4% on low-margin products can be less profitable than a store converting at 1.5% on high-margin products. Always pair conversion rate with average order value and contribution margin.
- Weekly dashboards should track 5 to 7 KPIs maximum. Monthly deep dives cover the full 15. Quarterly reviews compare against category benchmarks to identify structural issues versus seasonal variation.
Ecommerce metrics are the quantitative measurements that track how an online store performs across acquisition, conversion, retention, and profitability. Most stores track too many metrics and act on too few. A GA4 dashboard with 40 data points creates the illusion of insight while obscuring what’s actually driving profit or loss. This guide narrows the field to the 15 KPIs that connect directly to revenue decisions, with the formulas, category benchmarks, and tracking setup for each.
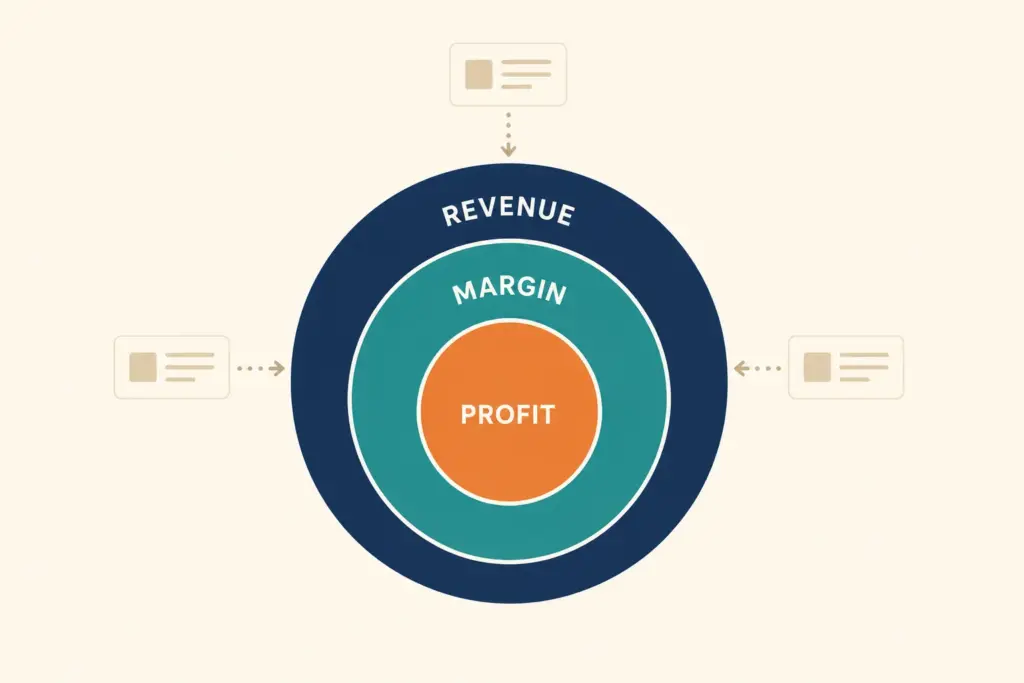
The metrics are organized into four tiers: revenue and profitability (the outcomes), conversion (the engine), acquisition (the input), and retention (the multiplier). Read them in that order because fixing a profitability problem with more traffic is the most expensive mistake in ecommerce. For analytics tool setup, see the GA4 ecommerce setup guide.
Tier 1: Revenue and Profitability Metrics
Revenue metrics answer “is this store making money?” Most sellers check gross revenue daily but never calculate the four numbers that determine whether revenue translates to profit.
1. Gross revenue
Total sales before any deductions. Formula: units sold x price per unit. Gross revenue is the most visible metric but the least useful in isolation because it says nothing about profitability. A store doing $100k/month in revenue can be losing money if margins, shipping costs, and customer acquisition costs aren’t tracked separately.
2. Contribution margin per order
The profit remaining after subtracting cost of goods sold (COGS), shipping, transaction fees, and packaging from the order total. Formula: (order revenue) – (product cost + shipping cost + payment processing fee + packaging). Target contribution margin is 30 to 50% for physical products, 60 to 80% for digital products. If contribution margin per order is below 20%, no amount of traffic solves the profitability problem. For deeper margin analysis, see the ecommerce profit margins guide.
3. Average order value (AOV)
Total revenue divided by number of orders. The AOV lever is underrated because a 10% AOV increase produces the same revenue impact as a 10% traffic increase, but costs nothing in ad spend. Track AOV weekly and segment by traffic source (paid vs organic vs email) since each channel typically produces different AOV. General benchmarks: fashion $80 to $120, beauty $50 to $70, electronics $150 to $250, food and beverage $35 to $55. For AOV growth tactics, see the upselling and cross-selling guide.
4. Customer lifetime value (LTV)
The total revenue a customer generates over their entire relationship with the store. Simple formula: AOV x purchase frequency x customer lifespan. A customer who orders $60 worth of skincare every 8 weeks for 2 years has an LTV of $780. LTV determines how much you can spend to acquire a customer. If LTV is $200, spending $50 to acquire that customer is profitable. If LTV is $60, the same $50 acquisition cost loses money. Track LTV by acquisition channel because email-acquired customers typically have 2 to 3x higher LTV than paid social customers.
5. LTV:CAC ratio
Customer lifetime value divided by customer acquisition cost. This single ratio tells you whether the business model works. Target 3:1 or higher. Below 3:1, acquisition costs are eating too much of the customer value. Above 5:1, you’re likely under-investing in growth and leaving market share on the table. Measure LTV:CAC by channel monthly to allocate budget toward channels that produce the best ratio.
Tier 2: Conversion Metrics
Conversion metrics answer “how efficiently does traffic turn into revenue?” They sit between acquisition (top of funnel) and profitability (bottom line), and they’re where most optimization effort should focus.
6. Conversion rate
Percentage of visitors who complete a purchase. Formula: (orders / sessions) x 100. Average ecommerce conversion rate runs 2.5 to 3.5% across all categories, but this average hides massive variation. Food and beverage stores convert at 3.5 to 4.5%. Electronics at 1.5 to 2.2%. Luxury at 0.8 to 1.5%. Always benchmark against your category, not the industry average. Track conversion rate by device (mobile vs desktop) since the mobile gap is where most revenue leaks. For the full optimization framework, see the ecommerce CRO guide.
7. Add-to-cart rate
Percentage of visitors who add at least one product to cart. Formula: (sessions with add-to-cart / total sessions) x 100. Benchmark: 8 to 12% for most categories. Below 5% signals a product page problem (images, pricing, descriptions, trust signals). Above 15% is strong. Add-to-cart rate isolates whether the issue is product appeal (product page) versus checkout friction (cart/checkout). Track in GA4 via the “add_to_cart” event.
8. Cart abandonment rate
Percentage of shoppers who add items to cart but don’t complete purchase. Formula: (1 – (completed purchases / carts created)) x 100. Industry average is 70.2% (Baymard Institute). Target 55 to 65% for a well-optimized store. If cart abandonment exceeds 75%, prioritize checkout fixes before anything else. Common causes: unexpected shipping costs (48%), forced account creation (26%), slow delivery (23%). For recovery tactics, see the cart abandonment solutions guide.
9. Checkout completion rate
Percentage of checkout initiations that result in a completed purchase. Formula: (orders / checkout initiations) x 100. Average runs 45 to 55%. Top-performing stores hit 65 to 75%. This metric isolates checkout-specific friction from broader cart abandonment. A low checkout completion rate with a healthy add-to-cart rate means the problem is between the cart and the confirmation page, not on the product page. For checkout fixes, see the checkout optimization guide.
Tier 3: Acquisition Metrics
Acquisition metrics answer “how much does it cost to bring buyers to the store?” They connect marketing spend to revenue. Tracking acquisition without conversion and profitability context is dangerous because you can acquire customers profitably on one channel while losing money on another.
10. Customer acquisition cost (CAC)
Total marketing and advertising spend divided by the number of new customers acquired. Formula: (total marketing spend) / (new customers acquired). Calculate CAC by channel (Facebook CAC, Google CAC, organic CAC) because blended CAC hides unprofitable channels. Healthy CAC depends on your LTV: if LTV is $300 and CAC is $80, that’s a 3.75:1 ratio (healthy). If LTV is $60 and CAC is $40, that 1.5:1 ratio will burn cash. Aim for CAC under 33% of LTV.
11. Return on ad spend (ROAS)
Revenue generated per dollar of advertising spend. Formula: (revenue from ads) / (ad spend). A ROAS of 4.0 means every $1 spent on ads generates $4 in revenue. Minimum viable ROAS depends on margins: at 50% contribution margin, you need 2.0 ROAS to break even on the ad spend. At 30% margin, you need 3.3 ROAS. Track ROAS by platform (Meta ROAS, Google ROAS, TikTok ROAS) and by campaign. Blended ROAS across all channels is the most honest measure since platform-reported ROAS often double-counts conversions.
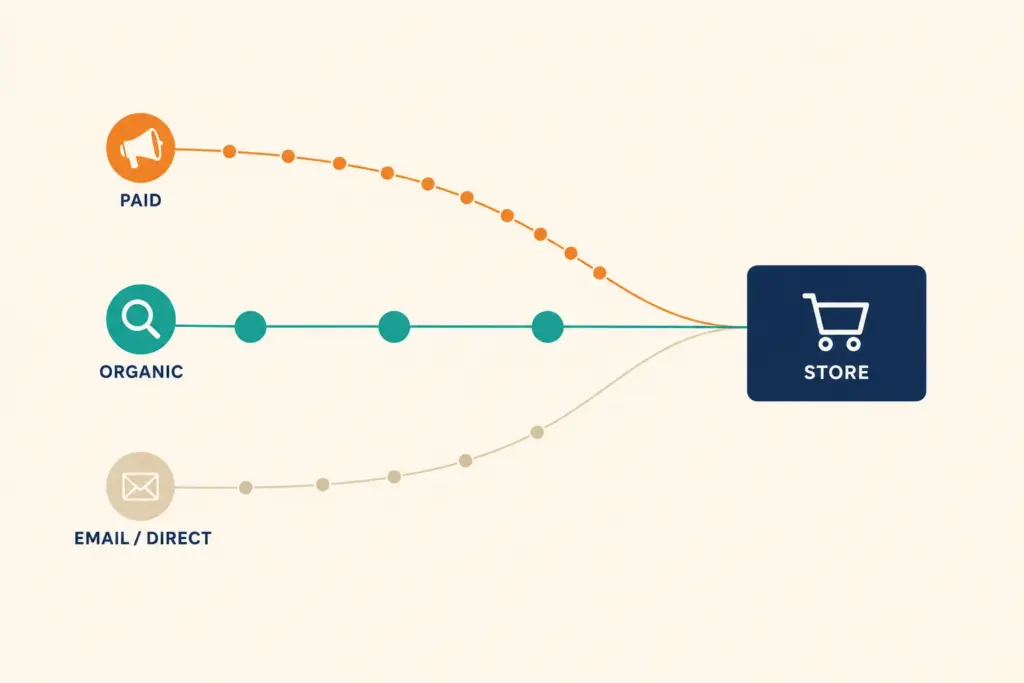
12. Traffic by source
Percentage breakdown of sessions by channel: organic search, paid search, paid social, email, direct, referral. This isn’t a single metric but a composition that reveals channel dependency risk. If 60%+ of traffic comes from one paid channel, any cost increase or algorithm change threatens the business. Healthy stores diversify: 25 to 35% organic, 20 to 30% paid, 15 to 25% email/direct, 10 to 20% social and referral. Track monthly and set alerts when any single channel exceeds 40%.
Tier 4: Retention Metrics
Retention metrics answer “do customers come back?” Acquiring a new customer costs 5 to 7x more than retaining an existing one. Retention is the multiplier that makes acquisition costs worthwhile.
13. Repeat purchase rate
Percentage of customers who make a second purchase within a defined period (typically 12 months). Formula: (customers with 2+ orders / total customers) x 100. Benchmark varies by category: consumables (food, beauty, supplements) should target 30 to 50%. Durable goods (furniture, electronics) target 10 to 20%. Fashion targets 20 to 35%. Below category average signals a product quality, email marketing, or customer experience issue. For retention tactics, see the customer retention guide.
14. Email revenue percentage
Percentage of total revenue attributed to email marketing (flows and campaigns). Healthy range: 25 to 40% of total revenue. Below 15% means email is underperforming and you’re over-reliant on paid acquisition. Above 50% may indicate the email attribution model is over-counting (check your attribution window). Track this monthly. Email revenue is the cheapest revenue source for established stores since the customer already exists in your database.
15. Return and refund rate
Percentage of orders returned or refunded. Formula: (returned orders / total orders) x 100. Average varies dramatically by category: fashion runs 20 to 30% returns (sizing issues), electronics 8 to 15%, beauty 3 to 8%, food under 2%. A return rate significantly above your category average signals product quality issues, misleading product descriptions, or sizing/specification problems. Every return costs 2 to 3x the shipping cost of the original order in reverse logistics, restocking, and customer service time.
How to Build an Ecommerce Metrics Dashboard
A useful dashboard shows the right metrics at the right frequency. Too much data creates noise. Too little hides problems.
Weekly dashboard (5 to 7 metrics)
Track these weekly: gross revenue (trend vs prior week), conversion rate by device, AOV, ROAS by channel, cart abandonment rate, email revenue percentage, and sessions by source. Weekly cadence catches problems before they compound. Review every Monday morning. Flag any metric that moves more than 15% from the prior week for investigation.
Monthly deep dive (full 15 metrics)
Once per month, review all 15 KPIs. Calculate LTV:CAC ratio, contribution margin per order, repeat purchase rate, and return rate alongside the weekly metrics. Monthly cadence is sufficient for metrics that move slowly (LTV, repeat rate, channel mix). Compare month-over-month and same-month-prior-year to separate trends from seasonality.
Quarterly benchmark comparison
Each quarter, compare your metrics against category benchmarks. Conversion rate, AOV, ROAS, and return rate all have published benchmarks by vertical. Persistent underperformance versus benchmarks indicates structural issues (wrong pricing, wrong traffic, wrong product-market fit) rather than tactical problems.
Where to build the dashboard
GA4 handles most conversion and acquisition metrics natively. Shopify Analytics and WooCommerce Reports cover revenue, AOV, and return metrics. For a unified view, Looker Studio (free, connects to GA4 and Sheets) or Triple Whale (paid, connects to ad platforms and Shopify) consolidates everything. Start with GA4 + a spreadsheet before paying for dashboard tools. For GA4 setup, see the GA4 ecommerce setup guide.
The Five Metrics Mistakes That Cost Ecommerce Stores Money
Tracking revenue without tracking margins
A store celebrating $50k revenue months while losing $5k to shipping costs, transaction fees, and returns is a store running blind. Revenue without contribution margin data creates false confidence. Calculate contribution margin per order before scaling any channel.
Trusting platform-reported ROAS
Facebook reports ROAS based on its attribution window. Google reports ROAS based on its attribution window. Both claim credit for the same purchase. Blended ROAS (total revenue / total ad spend across all platforms) is the honest metric. If blended ROAS is below your breakeven threshold, individual platform ROAS numbers don’t matter.
Ignoring LTV in acquisition decisions
A $60 CAC looks expensive until you know the customer’s LTV is $400 (6.7:1 ratio). A $15 CAC looks cheap until you learn the LTV is $25 (1.7:1 ratio). Every acquisition decision should reference LTV, not just first-order profitability.
Comparing conversion rate across traffic sources without context
Email traffic converts at 4 to 8% because those visitors already know the brand. Paid social traffic converts at 0.5 to 2% because those visitors are discovering the brand for the first time. Comparing the two rates and concluding “social ads don’t work” ignores that social ads build the audience that later converts through email. Segment conversion rate by traffic source and evaluate each channel against its own benchmarks.
Checking metrics without acting on them
A dashboard reviewed weekly without action items attached to each metric becomes a spectator sport. For every metric check, define a threshold that triggers action. If cart abandonment exceeds 75%, fix the checkout. If ROAS drops below 3.0, pause the underperforming campaigns. If repeat purchase rate drops below 20%, investigate product quality or post-purchase email flow. Metrics exist to trigger decisions, not to fill a screen.

Frequently Asked Questions
The five most important ecommerce metrics are customer lifetime value (LTV), customer acquisition cost (CAC), LTV:CAC ratio, contribution margin per order, and conversion rate by device. These five connect directly to profitability and growth decisions. Most other metrics are supporting data that feeds into these five.
Average ecommerce conversion rate is 2.5 to 3.5%. Good is category-dependent: food and beverage targets 4.5%+, fashion targets 3.0%+, electronics targets 2.2%+, luxury targets 1.5%+. Compare against your specific category, not the industry-wide average. Desktop converts 1.5 to 2.5x higher than mobile across all categories.
Simple LTV formula: average order value x average purchase frequency per year x average customer lifespan in years. For a skincare store: $55 AOV x 6.5 purchases per year x 2.5 year lifespan = $893 LTV. Pull AOV from Shopify or GA4 analytics, purchase frequency from your email platform (Klaviyo shows this), and estimate lifespan from your oldest customer cohort data.
GA4 (free) covers conversion, acquisition, and behavior metrics. Your ecommerce platform (Shopify Analytics, WooCommerce Reports) covers revenue, AOV, and order metrics. A spreadsheet or Looker Studio (free) unifies both into a dashboard. Add Triple Whale or Lifetimely only after exceeding $50k/month in revenue when per-channel LTV and attribution accuracy become worth the subscription cost.
Weekly for operational metrics (revenue, conversion rate, AOV, ROAS, cart abandonment). Monthly for strategic metrics (LTV, CAC, LTV:CAC ratio, repeat purchase rate, contribution margin). Quarterly for benchmark comparisons against industry data. Daily checking creates noise and reactive decision-making. Weekly is the minimum actionable frequency.
Target 3:1 or higher. A 3:1 ratio means the customer generates 3x more revenue than it cost to acquire them. Below 3:1 indicates acquisition costs are too high relative to customer value. Above 5:1 suggests you could invest more aggressively in acquisition to capture more market share. Measure by channel since email-acquired customers often have 4 to 6:1 ratios while paid social runs 2 to 3:1.
Related Reads
- GA4 Ecommerce Setup
- Ecommerce Profit Margins
- Ecommerce CRO Guide
- Cart Abandonment Solutions
- Customer Retention Guide
- AI Tools for Ecommerce
Enjoying this? Get more like it every week.
One email per week with ecommerce strategies, tool picks, and seller insights. No spam.