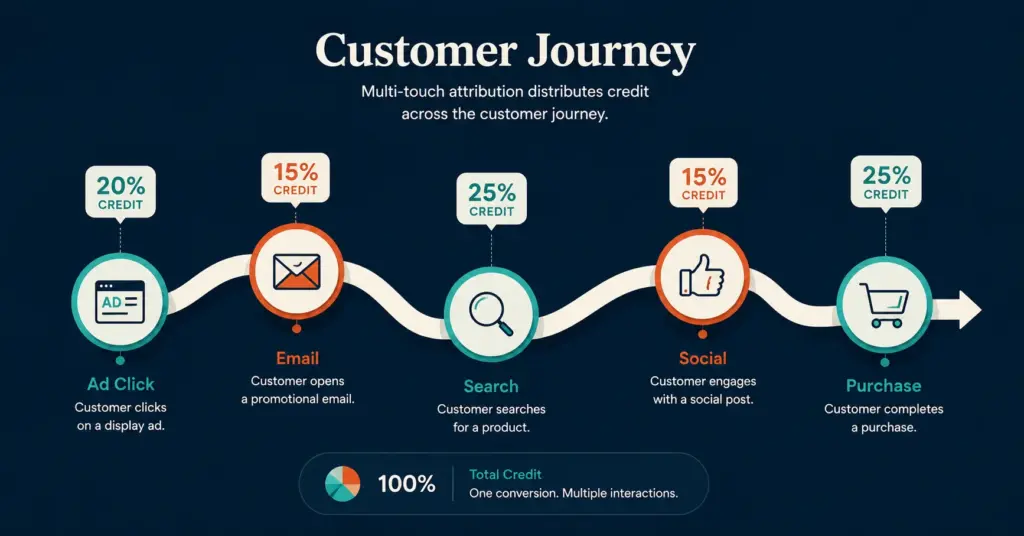
- Attribution modeling assigns credit for a conversion to the marketing touchpoints (ads, emails, organic search, social) a customer interacted with before purchasing. The model you choose determines how you read your data and where you spend your budget.
- GA4 now defaults to data-driven attribution, which uses machine learning to distribute credit based on actual conversion patterns. Most ecommerce stores should use data-driven as their primary model and last-click as a comparison baseline.
- Single-touch models (first-click, last-click) systematically over-credit one channel and under-credit others. Multi-touch models (linear, time-decay, position-based) spread credit more honestly but still use rules rather than data.
- The real solution for high-spend stores ($10k+ monthly ad budget) is incrementality testing: running holdout experiments that measure what would have happened without each channel, not just what happened with it.
Attribution modeling is the process of assigning credit for a sale or conversion to the different marketing touchpoints a customer interacted with before purchasing. A customer might click a Facebook ad on Monday, open an email on Wednesday, search your brand on Google Friday, and buy Saturday. Attribution modeling determines which of those touchpoints gets credit for the $50 sale, and how much. The model you choose directly shapes where you invest your next marketing dollar.
The problem is that every attribution model lies a little. First-click attribution says Facebook deserves all the credit. Last-click says Google brand search does. Linear attribution splits it equally. None of these models tell you what would have happened if you’d turned off any single channel. That deeper question, incrementality, is where attribution modeling is heading in 2026 and where the most sophisticated ecommerce brands already operate. For the tracking foundation that makes attribution possible, see our tracking setup guide.
This guide covers the 6 major attribution models, when each makes sense for ecommerce, how GA4’s data-driven model actually works, the gap between attribution and incrementality, and the practical setup that prevents bad budget decisions.
What Are the Different Attribution Models?
Attribution models fall into three categories: single-touch (credit goes to one touchpoint), multi-touch (credit spreads across several), and data-driven (machine learning decides). Each answers a different question about your marketing.
Single-touch models
| Model | How It Works | Best For | Blind Spot |
|---|---|---|---|
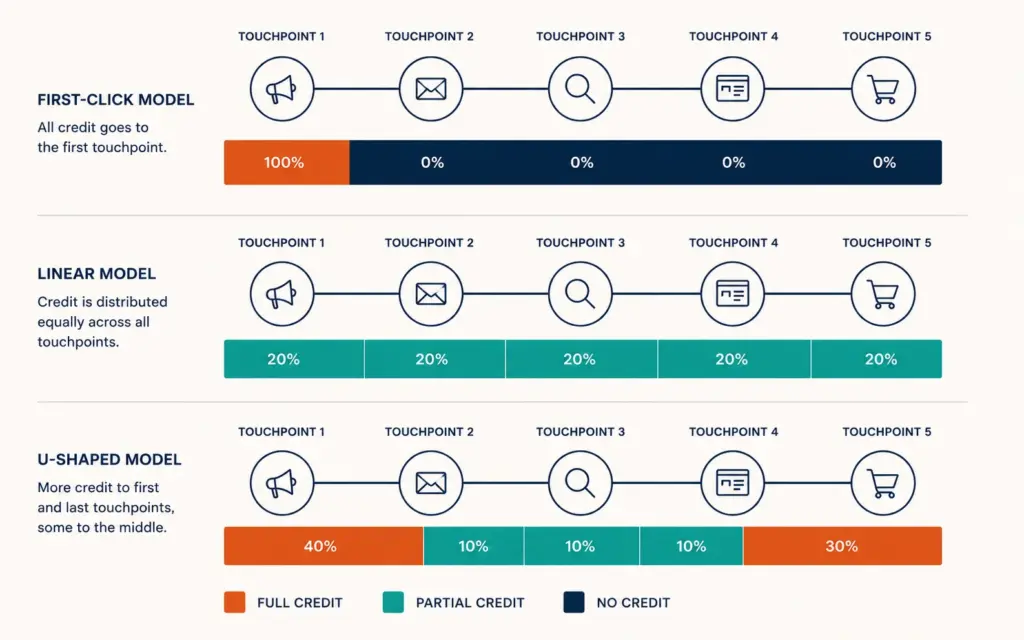
| First-click | 100% credit to the first interaction | Measuring awareness channels (display, YouTube, social) | Ignores everything that happened after discovery |
| Last-click | 100% credit to the final interaction before purchase | Measuring closing channels (brand search, retargeting, email) | Over-credits bottom-funnel, under-credits awareness |
| Last non-direct click | 100% credit to the last interaction excluding direct visits | Filtering out bookmarks and direct URL entries | Still ignores the full journey |
Multi-touch models
| Model | How It Works | Best For | Blind Spot |
|---|---|---|---|
| Linear | Equal credit to every touchpoint | Short buyer journeys (3 to 5 touchpoints) | Treats a banner impression the same as a product page visit |
| Time-decay | More credit to touchpoints closer to conversion | Longer sales cycles where recent interactions matter more | Under-values awareness channels that initiated the journey |
| Position-based (U-shaped) | 40% to first touch, 40% to last touch, 20% split among middle | Balanced view that values both discovery and closing | Arbitrary 40/40/20 split doesn’t reflect actual channel influence |
Data-driven attribution
Data-driven attribution (DDA) uses machine learning to analyze all conversion paths and assign credit based on how each touchpoint actually influenced the outcome. Instead of rules (40/40/20, equal split), DDA compares converting paths to non-converting paths and identifies which touchpoints made the difference. GA4 now defaults to DDA for all properties, and Meta’s attribution uses a similar approach within its platform.
DDA requires sufficient conversion volume to work. According to Google’s GA4 documentation, data-driven models need at least 400 conversions per 28-day period for reliable output. Below that threshold, GA4 falls back to a cross-channel last-click model. Most ecommerce stores with under $5k monthly ad spend don’t hit this threshold consistently.
Which Attribution Model Should I Use for My Store?
The right model depends on your store size, channel mix, and conversion volume. Here’s the practical recommendation:
Under $5k monthly ad spend
Use last-click as your primary model with first-click as a secondary comparison view. Your conversion volume is too low for data-driven attribution to be reliable. Last-click tells you which channels close sales; first-click tells you which channels introduce new customers. Run both reports monthly and look for channels that appear strong in first-click but weak in last-click (awareness channels deserving more budget) and vice versa.
$5k to $50k monthly ad spend
Use GA4’s data-driven attribution as your primary model. At this spend level, you typically generate enough conversions for DDA to work. Use last-click as a comparison baseline. When DDA and last-click disagree significantly on a channel’s value, investigate further. That disagreement usually reveals a channel that assists conversions without closing them (social, display) or one that gets credit it doesn’t deserve (brand search).
$50k+ monthly ad spend
Use data-driven attribution plus incrementality testing. At this spend level, the budget at risk from wrong attribution is significant. Incrementality testing (running holdout experiments where you turn off a channel for a subset of users and measure the revenue difference) gives you the most honest answer about each channel’s true contribution. For the analytics depth this requires, see our ecommerce KPIs guide.
How Does GA4 Data-Driven Attribution Work?
GA4’s data-driven model analyzes all user paths that led to conversions and compares them to paths that didn’t convert. The algorithm identifies which touchpoints appear more frequently in converting paths versus non-converting paths, and assigns credit proportionally.
What GA4 DDA actually does
- Collects all conversion paths: Every sequence of touchpoints (channel, source, medium, campaign) that led to a purchase
- Collects all non-conversion paths: Sequences that didn’t result in a purchase
- Compares patterns: Identifies which touchpoints are disproportionately present in converting paths
- Assigns fractional credit: Each touchpoint gets credit proportional to its influence on the conversion probability
Setting up DDA in GA4
GA4 defaults to data-driven attribution since late 2023. To verify or change your model: Admin > Attribution Settings > Reporting attribution model. The lookback window defaults to 30 days for acquisition and 90 days for other conversions. For ecommerce with longer consideration cycles (furniture, B2B), extend the lookback to 90 days for all conversion types.
Where GA4 DDA falls short
- Cross-device gaps: If a user browses on mobile but converts on desktop, GA4 may not connect the journey unless they’re signed into Chrome on both devices
- Walled gardens: Facebook, TikTok, and Amazon track conversions within their own ecosystems. GA4 can’t see those internal journeys, so it attributes based on the click that left the platform
- iOS limitations: Apple’s App Tracking Transparency blocks many cross-site tracking signals. Server-side tracking (Meta CAPI, Google Enhanced Conversions) partially recovers this data
- Low-volume instability: Below 400 conversions per 28 days, DDA produces unreliable and sometimes contradictory results
Why Do Meta, Google, and GA4 Show Different Numbers?
Every ad platform reports its own attribution, and the numbers never match. This isn’t a bug. It’s a feature of how each system measures.
The attribution disagreement problem
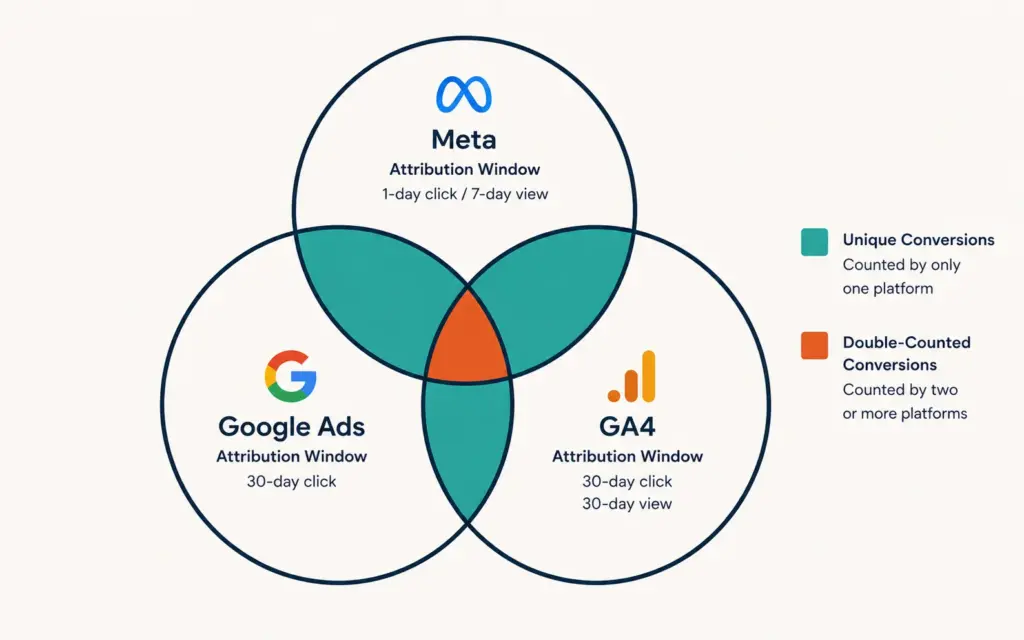
- Meta Ads Manager: Claims credit for any conversion within 7 days of a click or 1 day of a view. Includes view-through conversions (user saw ad, didn’t click, later converted). This inflates Meta’s reported conversions by 20 to 40% compared to GA4.
- Google Ads: Claims credit based on its own last-click or DDA model within Google’s channel ecosystem. Google can’t see Meta touchpoints.
- GA4: Attempts cross-channel attribution but is limited by cookie consent, iOS restrictions, and ad blocker rates. GA4 typically under-counts conversions by 15 to 30% compared to platform-reported numbers.
How to reconcile
Don’t try to make the numbers match. Instead, use each platform for its appropriate purpose:
- Meta Ads Manager: Optimize within-Meta campaign decisions (which creative, which audience, which placement)
- Google Ads: Optimize within-Google campaign decisions (which keywords, which bid strategy, which asset group)
- GA4: Cross-channel comparison and overall budget allocation decisions
- Server-side truth: Your actual Shopify/WooCommerce revenue is the ground truth. Compare total platform-attributed revenue to actual revenue. The gap reveals the degree of double-counting.
For the technical setup that minimizes these gaps, see our GA4 ecommerce setup guide.
What is Incrementality Testing?
Incrementality testing measures the causal impact of a marketing channel by comparing outcomes between a group exposed to the channel and a matched group that wasn’t. It answers the question attribution can’t: “What would have happened if I hadn’t run this campaign?”
How to run a basic incrementality test
- Pick a channel to test: Start with your second-largest ad spend channel (not the largest, too risky)
- Create a holdout group: Use geographic or audience-based splits. Show ads to 80% of the target audience, hold out 20%
- Run for 2 to 4 weeks: Long enough for statistical significance, short enough to limit budget risk
- Compare conversion rates: If the exposed group converts at 4% and the holdout at 3.2%, the channel’s incremental lift is 0.8 percentage points (20% of conversions are truly incremental)
- Calculate incremental ROAS: Incremental revenue / ad spend on that channel. This is the honest measure of channel profitability
What incrementality testing typically reveals
Most ecommerce brands discover that brand search (Google branded keywords) has near-zero incrementality because those customers would have found the site anyway. Retargeting ads show 30 to 50% incrementality (half of attributed conversions would have happened without the ad). Prospecting campaigns (cold audiences on Meta, TikTok) show 60 to 80% incrementality but look worse on last-click attribution. Research from Meta’s own measurement documentation confirms that conversion lift studies consistently reveal this pattern. This insight reshuffles budget from brand search to prospecting, typically lifting total revenue 10 to 20%.
How Do I Set Up Attribution for a Multi-Channel Store?
Practical attribution setup for stores selling across Shopify (or WooCommerce), Amazon, and social channels:
Step 1: Unified tracking foundation
Install GA4 with enhanced ecommerce events, Meta Pixel + Conversions API, Google Ads conversion tracking, and TikTok Pixel (if applicable). Use Google Tag Manager for centralized deployment. This gives you cross-channel visibility in GA4 and platform-specific optimization data in each ad manager. See our tracking setup guide for the complete implementation.
Step 2: UTM discipline
Tag every link you control with consistent UTM parameters. Without UTMs, GA4 attributes traffic as “direct” or “referral” with no campaign-level granularity. Minimum UTM structure: source (facebook, google, email), medium (cpc, organic, email), campaign (spring-sale-2026, prospecting-lookalike). Keep a UTM tracking spreadsheet shared across team members.
Step 3: Server-side tracking
Meta Conversions API and Google Enhanced Conversions recover 15 to 30% of attribution data lost to iOS privacy restrictions and ad blockers. Without server-side tracking, your attribution data has a 30 to 50% blind spot. This is no longer optional for stores spending on paid ads. For broader analytics context, see our AI tools for ecommerce guide.
Step 4: Monthly attribution review
Compare GA4 DDA channel report, Meta reported ROAS, Google Ads reported ROAS, and actual Shopify revenue. Note discrepancies. Adjust budget toward channels where DDA credits more than last-click (usually awareness channels). Reduce budget on channels where DDA credits less than last-click (usually brand search). Review quarterly with a longer window to account for seasonality.
Common Attribution Modeling Mistakes
Optimizing entirely on last-click
Last-click attribution systematically over-credits brand search and retargeting while under-crediting prospecting and awareness channels. Stores that optimize purely on last-click gradually shift budget to bottom-funnel channels, starving the top of funnel, and wonder why new customer acquisition slows. If you can only run one model, use data-driven or position-based instead.
Trusting platform-reported numbers as truth
Meta, Google, and TikTok all over-report conversions because their attribution windows overlap. A single purchase might be claimed by all three platforms. Always compare total platform-reported revenue to actual revenue. The sum of all platforms typically exceeds actual revenue by 30 to 60%.
Ignoring view-through conversions entirely
View-through conversions (user saw an ad but didn’t click, later converted) are genuinely influenced by the ad impression in some cases. Ignoring them entirely under-credits display and video advertising. However, attributing full credit to a 1-second ad impression overstates impact. A reasonable middle ground: count view-through at 20 to 30% of click-through value for budget allocation. For retention channel optimization, see our customer retention guide.
Changing models mid-campaign
Switching attribution models changes all historical reporting, making before-and-after comparisons unreliable. Pick a primary model, commit to it for at least 6 months, and compare secondary models as directional signals rather than switching primary models every quarter.
Skipping incrementality testing at scale
Above $10k monthly ad spend, every attribution model produces meaningful errors. Incrementality testing is the only way to measure true channel contribution. Even a simple geo-based holdout test once per quarter produces better budget decisions than sophisticated attribution modeling without experimental validation. For deeper analytics maturity, see our ecommerce profit margins guide.
Frequently Asked Questions
Attribution modeling is the process of assigning credit for a sale to the marketing touchpoints a customer interacted with before purchasing. It helps ecommerce brands understand which channels (paid ads, email, organic search, social media) actually drive revenue and which get credit they don’t deserve. Different models assign credit differently: first-click credits the discovery channel, last-click credits the closing channel, and data-driven models use machine learning to distribute credit based on actual conversion patterns.
For most ecommerce stores with sufficient conversion volume (400+ per month), GA4’s data-driven attribution is the best default because it uses actual conversion path data rather than arbitrary rules. Stores with lower volume should use last-click as a primary model with first-click as a comparison. High-spend stores ($50k+ monthly) should combine data-driven attribution with incrementality testing for the most accurate channel valuation.
Each platform uses its own attribution model and window. Meta attributes conversions within 7 days of a click or 1 day of an ad view. Google Ads attributes based on its own click and conversion tracking. GA4 attempts cross-channel attribution with different rules. The same purchase can be claimed by multiple platforms simultaneously. Compare total platform-reported revenue to actual Shopify revenue to measure the overlap; the sum typically exceeds actual revenue by 30 to 60%.
Incrementality testing measures the causal impact of a marketing channel by comparing outcomes between a group exposed to the channel and a matched holdout group that wasn’t. It answers the question attribution can’t: “What would have happened without this campaign?” Most brands discover that branded search has near-zero incrementality while prospecting campaigns (cold audiences) show 60 to 80% incrementality, often reshuffling budget allocation significantly.
GA4 defaults to data-driven attribution. Verify in Admin > Attribution Settings > Reporting attribution model. Set the lookback window (30 days for most ecommerce, 90 days for longer consideration cycles). Ensure all traffic sources have proper UTM tagging, install server-side tracking (Meta CAPI, Google Enhanced Conversions), and confirm ecommerce events are firing correctly. Without clean data inputs, no attribution model produces reliable outputs.
Neither as your only model. First-click over-credits awareness channels; last-click over-credits closing channels. Use both as comparison views: channels that score well on first-click but poorly on last-click are awareness channels (social, display) that deserve more credit than last-click gives them. Channels that score well on last-click but poorly on first-click (brand search, retargeting) may get more credit than they deserve. Data-driven attribution provides a better single model than either.
Related Reads
- Tracking Setup Guide
- GA4 Ecommerce Setup
- Ecommerce KPIs Guide
- AI Tools for Ecommerce
- Customer Retention Guide
- Ecommerce Profit Margins
Enjoying this? Get more like it every week.
One email per week with ecommerce strategies, tool picks, and seller insights. No spam.