- Checkout optimization is the process of reducing friction in the purchase completion flow to increase the percentage of cart-adders who become buyers. Average ecommerce checkout completion runs 45 to 55%, meaning 45 to 55% of shoppers who start checkout never finish.
- The 5 highest-impact checkout fixes are: enabling guest checkout (lifts completion 12 to 18%), adding wallet payments like Apple Pay and Google Pay (lifts mobile conversion 30 to 40%), reducing form fields from 14 to 6 to 8 (each removed field improves completion roughly 1.5%), showing total cost on the cart page before checkout, and adding trust signals at the payment step.
- Mobile checkout deserves separate optimization from desktop. Mobile checkout completion runs 15 to 20 percentage points lower than desktop, and mobile accounts for 60 to 75% of ecommerce traffic. Fixing mobile checkout often returns more revenue than any single marketing campaign.
- Checkout optimization compounds with cart abandonment recovery. Optimized checkout reduces the pool of abandoners, and recovery sequences (email, SMS) reclaim a percentage of the remaining ones. Together they can recover 25 to 40% of otherwise lost revenue.
Checkout optimization is the process of reducing friction in the purchase completion flow to increase the percentage of shoppers who start checkout and actually finish paying. Average ecommerce checkout completion rates run 45 to 55%, according to Baymard Institute’s cart abandonment research, meaning nearly half of shoppers who add items and begin checkout never complete the purchase. For a store processing 1,000 checkout starts per month at a $50 average order, a 10-percentage-point improvement in completion adds $50,000 in annual revenue with zero additional traffic spend.
The fixes aren’t mysterious. Baymard’s research across 100+ usability studies consistently identifies the same friction points: unexpected costs revealed too late, forced account creation, too many form fields, limited payment options, and mobile-specific UX failures. Each fix is individually small (2 to 5% lift) but compounds. Five fixes implemented together can lift checkout completion 15 to 30%. For the recovery side after abandonment, see our cart abandonment solutions guide.
This guide covers the 15 highest-impact checkout optimization fixes ranked by typical conversion lift, the mobile-specific optimizations that close the desktop-mobile gap, the measurement framework that validates each change, and the implementation priority that produces the fastest revenue improvement.
Why Do Shoppers Abandon at Checkout?
Understanding the specific reasons shoppers abandon mid-checkout (not just mid-cart) determines which fixes produce the largest return:
| Checkout Abandonment Reason | % of Abandonments | Fix Category |
|---|---|---|
| Extra costs (shipping, tax, fees) revealed at checkout | 48% | Price transparency |
| Required to create an account | 26% | Guest checkout |
| Too long or complicated checkout process | 22% | Field reduction |
| Didn’t trust the site with payment info | 18% | Trust signals |
| Total cost couldn’t be calculated upfront | 16% | Price transparency |
| Delivery was too slow | 16% | Shipping options |
| Not enough payment methods | 11% | Payment options |
| Website had errors or crashed | 10% | Technical performance |
The top 3 reasons (costs, accounts, complexity) account for 60 to 70% of checkout abandonment and are the cheapest to fix. Start there.
What Are the 15 Highest-Impact Checkout Fixes?
Price transparency fixes
1. Show estimated shipping on the cart page. Use IP-based location detection to estimate shipping before checkout begins. Stores that expose shipping costs on the cart page (not just at checkout step 3) see 22 to 35% reduction in price-shock abandonment. Implementation: most platforms have apps that calculate shipping from zip code or IP geolocation.
2. Display total cost early. Show subtotal + estimated tax + estimated shipping on the cart page and maintain a running total throughout checkout. The goal is zero surprises at the final payment step. Surprise costs are the single most cited abandonment trigger. For pricing strategy depth, see our ecommerce pricing strategy guide.
3. Add a free shipping threshold. “Free shipping on orders over $X” displayed on product pages and the cart page lifts AOV 8 to 15% while eliminating the shipping-cost abandonment trigger for qualifying orders. Set the threshold at 15 to 25% above your current average order value. Show a progress bar (“$12 away from free shipping”) in the cart.
Account and access fixes
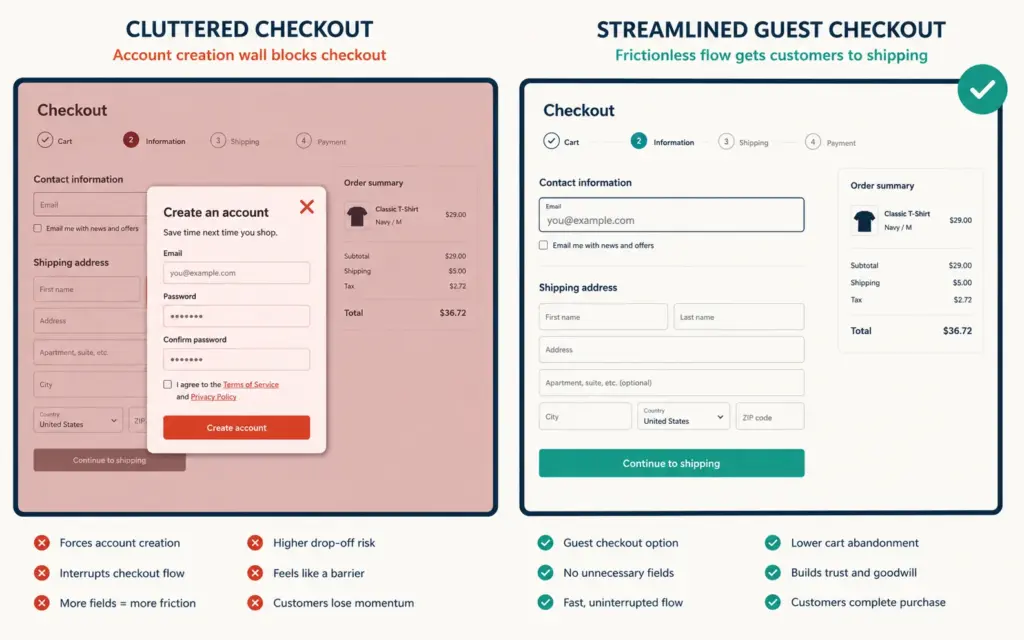
4. Enable guest checkout. Forced account creation causes 26% of checkout abandonment. Allow guest checkout and offer post-purchase account creation with a single click (“Save your info for faster checkout next time”). Stores that switched from forced-account to guest checkout report 12 to 18% checkout completion lift within the first 30 days.
5. Offer social login as an alternative. “Continue with Google” or “Continue with Apple” reduces friction for shoppers who don’t want to type credentials. Social login lifts account creation rates 20 to 30% compared to email/password forms while feeling faster than guest checkout for returning shoppers.
Form and field fixes
6. Reduce form fields to 6 to 8. The average ecommerce checkout has 14.88 form fields per Baymard’s research. Top-performing stores run 6 to 8 fields. For each field removed, checkout completion improves roughly 1.5%. High-impact removals: phone number (unless needed for shipping notifications), company name, address line 2 (make optional, not required).
7. Auto-detect city and state from zip code. Let the shopper enter their zip code first, then auto-populate city and state. Saves 2 fields of manual entry and eliminates city-spelling errors that cause shipping failures. Most checkout platforms support this through built-in functionality or a simple JavaScript integration.
8. Combine first and last name into one field. “Full name” instead of separate first/last name fields saves one field and reduces cognitive overhead. Most payment processors accept full name as a single string. The combined field reduces completion friction without any functional downside.
9. Inline validation with real-time feedback. Show green checkmarks as fields are completed correctly and red error messages immediately (not after form submission). Inline validation reduces form errors 20 to 30% and reduces re-submission attempts that cause frustration-driven abandonment. For broader A/B testing on checkout changes, see our A/B testing guide.
Payment method fixes
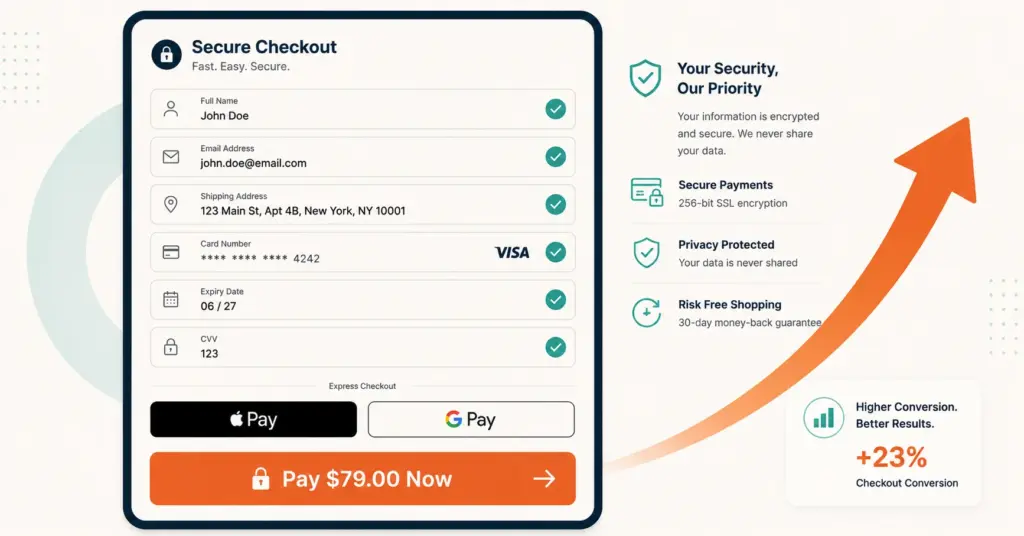
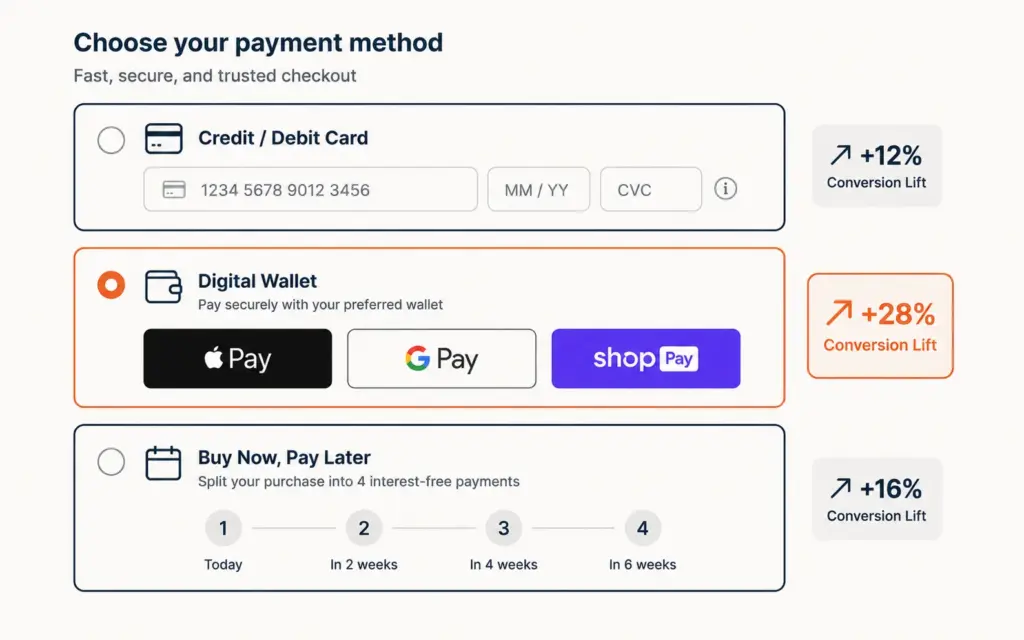
10. Add Apple Pay, Google Pay, and Shop Pay. Wallet payment methods let mobile shoppers pay with a fingerprint or face scan instead of typing 16-digit card numbers on a phone screen. Mobile conversion lifts 30 to 40% with wallet payments enabled. At 60 to 75% mobile traffic share, this is often the single highest-ROI checkout optimization. Setup through Shopify Payments, Stripe, or your platform’s native configuration. For payment setup details, see our payment gateway setup guide.
11. Add buy-now-pay-later for orders above $50. Klarna, Affirm, and Afterpay split payments into 4 installments at no interest to the buyer. According to Klarna’s merchant data, BNPL lifts conversion 20 to 30% on qualifying orders (typically $50+) and increases AOV 30 to 50%. The cost to merchants runs 3 to 6% per transaction, offset by the conversion and AOV lift.
12. Display accepted payment logos visually. Show Visa, Mastercard, Amex, PayPal, and wallet logos near the payment form. Visual payment method indicators reduce trust anxiety and lift completion 3 to 7%. Use real brand logos (card networks provide official assets) rather than generic icons.
Trust and security fixes
13. Add security badges at the payment step. SSL padlock, Norton Secured, McAfee Secure, or platform-specific trust badges (Shopify Secure) near the credit card form reduce trust-based abandonment 5 to 12%. The badge reassures shoppers at the exact moment of highest anxiety (entering payment info). Position badges below the payment form, not in the footer where nobody sees them.
14. Show a money-back guarantee prominently. “30-day money-back guarantee” or “Free returns within 30 days” displayed near the checkout button reduces purchase anxiety and lifts completion 4 to 8%. Guaranteed return policies increase conversion more than they increase actual returns because most buyers never use the guarantee.
Technical performance fix
15. Optimize checkout page load speed. Every 1 second of additional load time costs roughly 7% in conversion on checkout pages. Run Google PageSpeed Insights on your cart and checkout URLs quarterly. Target Largest Contentful Paint under 2.5 seconds. Common speed killers: unoptimized images, excessive JavaScript from third-party apps, and render-blocking CSS. For technical SEO depth, see our ecommerce technical SEO guide.
How Should I Optimize Checkout for Mobile?
Mobile checkout completion runs 15 to 20 percentage points lower than desktop. With mobile accounting for 60 to 75% of ecommerce traffic, the mobile checkout gap represents the largest single revenue opportunity for most stores.
Mobile-specific optimizations
- Thumb-zone CTA placement: Place the primary checkout button within natural thumb reach (bottom third of screen). Top-placed CTAs require hand repositioning on large phones.
- Input type attributes: Use type=”tel” for phone fields, type=”email” for email, inputmode=”numeric” for card numbers. This triggers the correct mobile keyboard automatically, eliminating keyboard switching.
- Larger tap targets: All buttons and form fields minimum 44×44 pixels. Shoppers with larger fingers misclick smaller targets, causing frustration.
- Persistent order summary: Show a collapsible order summary at the top of mobile checkout so shoppers can verify items without navigating back. Hiding the order summary on mobile increases abandonment from uncertainty about cart contents.
- Single-column layout: Two-column checkout forms on mobile force horizontal scrolling or create tiny, unusable fields. Always single-column on viewports under 768px.
The mobile checkout audit
Test your checkout monthly on 3 actual devices (iPhone, Android phone, iPad). Automated testing misses finger-size interaction issues. Walk through the complete flow: add to cart, enter shipping info, enter payment, complete purchase. Time yourself. If checkout takes more than 90 seconds on mobile, you have friction to remove.
How Do I Measure Checkout Optimization Impact?
The measurement framework that validates whether each change actually worked:
The 4 checkout metrics
- Cart-to-checkout rate: Percentage of cart viewers who begin checkout. Benchmark: 50 to 65%. Below 50% signals cart page issues (surprise shipping, unclear CTAs).
- Checkout completion rate: Percentage of checkout starters who finish payment. Benchmark: 45 to 55%. Below 40% signals serious checkout friction.
- Checkout abandonment rate by step: Where in the checkout flow shoppers drop off. The step with the highest drop-off is your first optimization target.
- Revenue per visitor (RPV): Total revenue divided by total visitors. The holistic metric that captures whether checkout improvements actually lift revenue or just shift timing.
Setting up step-level tracking
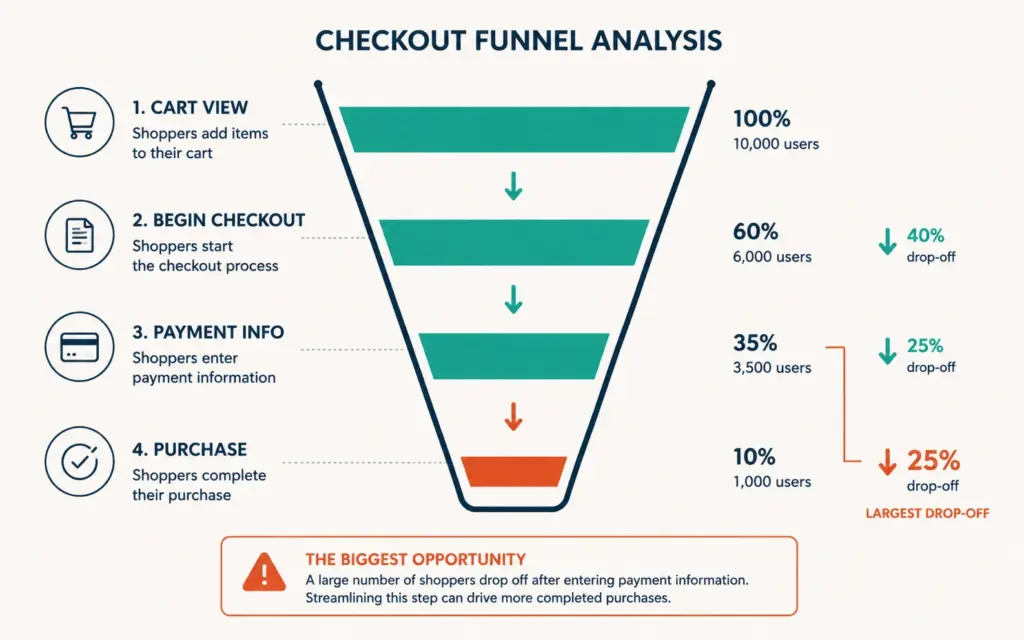
GA4 ecommerce events (begin_checkout, add_shipping_info, add_payment_info, purchase) create a checkout funnel in the Explore report. The step with the largest drop-off is where you spend optimization effort first. Most stores find the payment step has the highest drop-off, followed by shipping info. See our GA4 ecommerce setup guide for event implementation.
What is the Optimization Priority Order?
Fix in this sequence for fastest revenue impact:
- Week 1: Enable guest checkout + add wallet payments (Apple Pay, Google Pay). Largest individual lifts with simplest implementation.
- Week 2: Reduce form fields to 6 to 8. Add zip-code auto-detection for city/state. Add inline validation.
- Week 3: Show shipping estimate on cart page. Add free shipping threshold with progress bar.
- Week 4: Add trust badges near payment form. Add money-back guarantee message. Display payment method logos.
- Month 2: Add BNPL option. Optimize mobile checkout specifically. Run page speed audit on checkout pages.
- Ongoing: A/B test individual elements monthly. Monitor step-level drop-off in GA4 weekly. For testing depth, see our A/B testing guide.
Most stores complete the first 4 weeks in 10 to 15 hours of work, primarily configuration changes rather than custom development. The combined lift from all 15 fixes typically runs 15 to 30% improvement in checkout completion rate.
Common Checkout Optimization Mistakes
Requiring account creation before payment
The single most impactful fix (guest checkout) is also the most commonly resisted because stores want customer data upfront. The data shows that guest checkout captures more customers at lower friction, and post-purchase account creation converts 30 to 50% of guests into accounts anyway. Collect the data after you collect the money.
Adding “bonus” fields that increase abandonment
Phone number, company name, birthday, “how did you hear about us” survey. Each additional field costs roughly 1.5% in checkout completion. If the field isn’t required for shipping or payment, remove it from checkout and collect it post-purchase through email or a profile completion prompt.
Hiding the order total until the last step
Progressive cost reveals (showing product price, then adding shipping, then adding tax at the final step) trigger the #1 abandonment reason: unexpected costs. Show the complete estimated total including shipping and tax from the cart page forward. Transparency prevents abandonment better than any recovery tactic fixes it after the fact.
Not testing checkout changes
Even “obvious” improvements sometimes reduce conversion in unexpected ways. A/B test every checkout change against the existing version for 14+ days before permanent implementation. The change you were most confident about is sometimes the one that performs worse. For measurement accuracy, see our attribution modeling guide.
Frequently Asked Questions
Checkout optimization is the process of reducing friction in the purchase completion flow to increase the percentage of shoppers who finish paying. Average ecommerce checkout completion runs 45 to 55%. The highest-impact fixes include enabling guest checkout (12 to 18% lift), adding wallet payments (30 to 40% mobile lift), reducing form fields from 14 to 6 to 8 (1.5% per field), showing costs early, and adding trust signals near payment forms.
Average checkout completion runs 45 to 55% across ecommerce. Top-performing stores achieve 60 to 70% through optimized flows, wallet payments, and guest checkout. Below 40% signals serious friction issues. Completion rate varies by device: desktop typically 55 to 65%, mobile 35 to 50%. Industry vertical also matters: digital products achieve higher completion (low shipping anxiety) while furniture and electronics trend lower (high consideration).
Multi-step checkout with progress indicators outperforms single-page checkout for most ecommerce stores. Multi-step feels less overwhelming, displays cleaner on mobile, and enables step-level analytics. However, the step count matters: 2 to 3 steps (shipping, payment, confirmation) outperform 4 to 5 step flows. One-page checkout works for simple products with fewer shipping options and returning customers who prefer speed.
Apple Pay and similar wallet payments (Google Pay, Shop Pay) lift mobile checkout conversion 30 to 40% on average. The mechanism: shoppers authenticate with fingerprint or face scan instead of typing 16-digit card numbers on phone screens. At 60 to 75% mobile traffic share, wallet payments are often the single highest-ROI checkout optimization. Setup is straightforward through Shopify Payments, Stripe, or most platform-native payment configurations.
Target 6 to 8 form fields. The average checkout has 14.88 fields, and each removed field improves completion roughly 1.5%. Essential fields: email, full name, shipping address (street, city, state, zip, country), and payment information. Remove: phone number (make optional), company name, address line 2 (make optional), and any survey or preference questions. Use zip-code auto-detection for city and state to save 2 additional fields.
Yes. BNPL options (Klarna, Affirm, Afterpay) lift conversion 20 to 30% on qualifying orders (typically $50+) and increase average order value 30 to 50%. The cost to merchants runs 3 to 6% per transaction, which is typically offset by the conversion and AOV lift. BNPL is most effective for products above $50 where payment splitting reduces the perceived financial commitment. Display the installment amount (“4 payments of $12.50”) near the product price.
Related Reads
- Cart Abandonment Solutions
- Product Page Design Guide
- A/B Testing for Ecommerce
- GA4 Ecommerce Setup
- Attribution Modeling
- Payment Gateway Setup
Enjoying this? Get more like it every week.
One email per week with ecommerce strategies, tool picks, and seller insights. No spam.