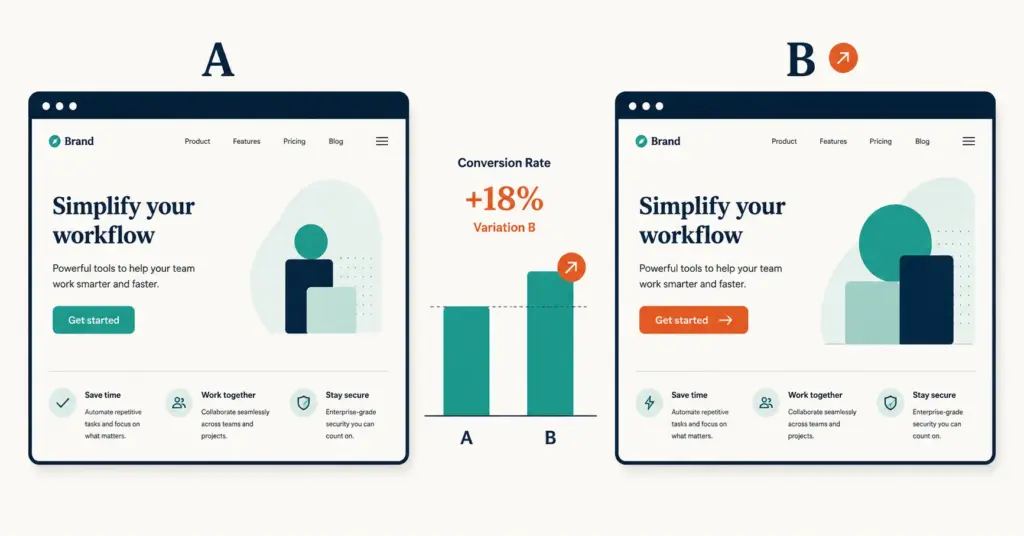
- A/B testing (split testing) compares two versions of a page, element, or flow to measure which drives more conversions. Ecommerce stores that test consistently grow revenue 15 to 25% faster than those that redesign based on opinions.
- The 12 highest-ROI ecommerce tests are: product page hero image, CTA button text, price display format, shipping threshold, checkout field count, payment method options, mobile layout, product description format, social proof placement, cart page layout, exit-intent offer, and email subject lines.
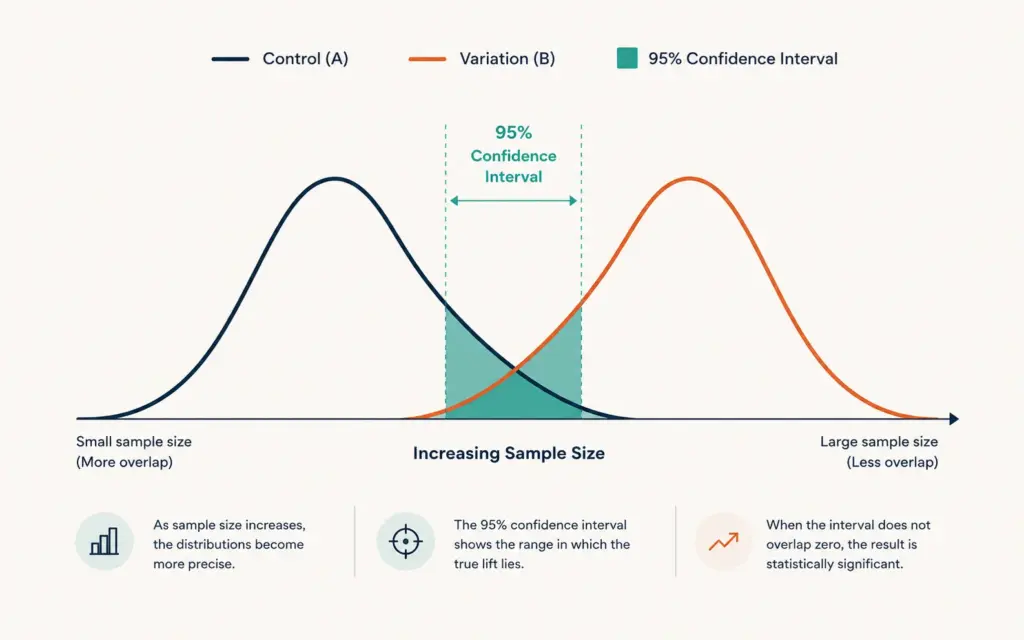
- Statistical significance at 95% confidence requires enough traffic and conversions to distinguish real differences from random noise. Most ecommerce tests need 1,000 to 5,000 visitors per variation and 100+ conversions per variation over 14 to 28 days.
- The most common A/B testing mistake is ending tests too early. A test that shows "Variation B is winning by 15%" after 3 days and 40 conversions is statistically meaningless. Wait for significance, not excitement.
AB testing ecommerce (also written as A/B split testing) is the practice of comparing two versions of a page, element, or checkout flow to measure which produces more conversions or revenue. One version (control) stays unchanged while the other (variation) changes a single element. Traffic splits randomly between both, and statistical analysis determines whether the difference in performance is real or random noise. According to VWO’s experimentation research, ecommerce stores that run structured testing programs grow revenue 15 to 25% faster than those that redesign based on opinions or best-practice assumptions.
The value of A/B testing compounds because every validated improvement becomes permanent. A 5% conversion lift from a better CTA button stays in place while you test the next element. After 10 successful tests each lifting conversion 3 to 5%, the compounded effect can double revenue per visitor without increasing traffic spend. For broader conversion strategy, see our product page design guide.
This guide covers how A/B testing works mechanically, the 12 highest-ROI tests for ecommerce stores, the statistical significance requirements that prevent false conclusions, and the tools and workflow that make testing accessible for stores of all sizes.
How Does A/B Testing Work?
A/B testing follows a five-step process. Skipping any step produces unreliable results.
- Hypothesis: Define what you believe will happen. “Changing the Add to Cart button from gray to orange will increase add-to-cart rate by 5% because the current button doesn’t stand out visually.” A clear hypothesis prevents post-hoc rationalization.
- Setup: Create the variation (one change only). Configure the testing tool to split traffic 50/50 between control and variation. Set the primary metric (conversion rate, revenue per visitor, add-to-cart rate).
- Run: Let the test run until statistical significance at 95% confidence is reached, typically 14 to 28 days for most ecommerce stores. Do not peek at results and end early.
- Analyze: Compare the primary metric between control and variation. If the variation wins with 95%+ statistical significance, implement it permanently. If inconclusive or control wins, discard the variation and test a different hypothesis.
- Document: Record what was tested, the result, the confidence level, and the revenue impact. This builds institutional knowledge and prevents re-testing the same ideas.
What makes a valid test
Three conditions must be met for A/B test results to be trustworthy:
- Sufficient sample size: 1,000 to 5,000 visitors per variation and 100+ conversions per variation. Below these thresholds, random noise dominates.
- Single variable: Change only one element per test. Testing a new button color AND new copy AND a new layout simultaneously makes it impossible to identify which change caused the result.
- Full business cycle: Run for at least 14 days to capture weekday/weekend patterns and payment-cycle effects. A test that runs only Tuesday through Thursday misses weekend shoppers with different behavior.
What Are the 12 Highest-ROI Tests for Ecommerce?
Not all tests deliver equal value. These 12 tests consistently produce the largest revenue impact across ecommerce stores:
Product page tests
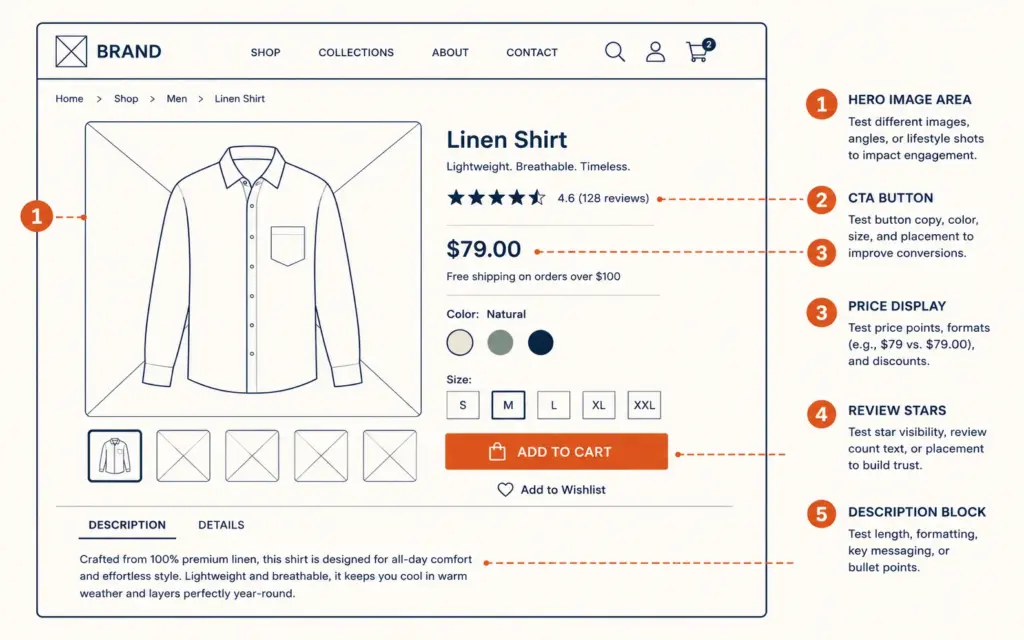
1. Hero image format. Test lifestyle photography vs white-background product shots as the primary image. Lifestyle images convert 7 to 15% better for apparel and home goods; white-background wins for electronics and tools. The difference is often the single largest conversion lever on the page.
2. CTA button text and color. “Add to Cart” vs “Buy Now” vs “Add to Bag.” Orange and green buttons typically outperform gray and blue by 3 to 8%. The combination of copy and color creates a stronger signal than either alone.
3. Price display format. Test “$29.99” vs “$29.99 ($39.99)” with strikethrough vs “$29.99/month” for subscriptions. Anchor pricing (showing original price crossed out) lifts conversion 5 to 12% when the discount is credible.
4. Social proof placement. Test reviews above the fold vs below the product description vs as a floating sidebar count. Above-the-fold review stars lift conversion 4 to 8% for products with 50+ reviews. Below-the-fold reviews work better for products with fewer than 20 reviews (less visible = less risky). For deeper product page strategy, see our product page design guide.
5. Product description format. Test paragraph-style descriptions vs bullet-point features vs tabbed layouts (Description / Specs / Reviews tabs). Bullet-point formats win for comparison shoppers (electronics, tools); paragraph narratives win for lifestyle and story-driven products (fashion, food, beauty).
Checkout and cart tests
6. Shipping threshold display. Test “Free shipping on orders over $50” shown on product pages vs only at checkout. Displaying the threshold on product pages lifts AOV 8 to 15% as shoppers add items to reach the free-shipping bar.
7. Checkout field count. Test 12-field checkout vs 6-field checkout (remove phone, company, address line 2 defaults). Each removed field improves checkout completion roughly 1.5%. Auto-filling city and state from zip code is a particularly high-impact change. For the full checkout playbook, see our cart abandonment solutions guide.
8. Payment method options. Test adding Apple Pay + Google Pay + Shop Pay to checkout. Mobile shoppers convert 30 to 40% better with wallet payment options. Test adding buy-now-pay-later (Klarna, Affirm) for orders above $80. Conversion lift typically runs 15 to 25% on qualifying orders.
9. Cart page layout. Test product-thumbnail-with-edit vs text-only cart summaries. Test progress indicators (“Step 1 of 3”) vs no progress. Test mini-cart drawer vs full-page cart. Mini-cart drawers typically reduce cart abandonment 5 to 10% by keeping shoppers on the product page.
Site-wide tests
10. Mobile layout. Test mobile-specific layouts vs responsive desktop layouts. Dedicated mobile optimization (larger tap targets, simplified navigation, thumb-zone CTA placement) lifts mobile conversion 10 to 25%. Given mobile traffic accounts for 60 to 75% of most ecommerce stores, this is the highest-absolute-impact test category.
11. Exit-intent offer. Test showing a popup offering 10% off when the cursor moves toward closing the tab. Conversion rates on exit-intent offers run 2 to 5% of triggered visitors. The key variable: discount percentage (5% vs 10% vs free shipping). Free shipping offers often match or beat percentage discounts. For discount strategy depth, see our discount strategy guide.
12. Email subject lines. Test subject line variants on abandoned cart and promotional emails. Subject lines are the highest-impact email test because they determine whether the email is opened at all. Open rate differences of 5 to 15% between subject line variants are common.
How Much Traffic Do I Need for A/B Testing?
The minimum traffic for reliable A/B testing depends on your conversion rate and the minimum detectable effect (MDE) you want to measure.
| Current Conversion Rate | MDE You Want to Detect | Visitors Per Variation | Days at 500/day Traffic |
|---|---|---|---|
| 2% | 10% relative lift | 19,500 | 78 days |
| 2% | 20% relative lift | 5,000 | 20 days |
| 5% | 10% relative lift | 7,200 | 29 days |
| 5% | 20% relative lift | 1,850 | 8 days |
| 10% | 10% relative lift | 3,200 | 13 days |
| 10% | 20% relative lift | 850 | 4 days |
These numbers assume 95% statistical significance and 80% statistical power (standard thresholds). The practical minimum for most ecommerce A/B tests is 1,000 visitors per variation and at least 100 conversions per variation. Stores with fewer than 10,000 monthly visitors should focus on fewer, higher-impact tests rather than trying to run multiple simultaneous experiments.
What is statistical significance?
Statistical significance at 95% confidence means there’s only a 5% chance the observed difference between control and variation occurred by random chance. It does NOT mean the variation is 95% likely to be better. The distinction matters: reaching significance requires enough data that the observed pattern is unlikely to be noise. According to Optimizely’s experimentation glossary, rushing to conclusions before significance is the most common testing mistake in ecommerce.
What A/B Testing Tools Work for Ecommerce?
The right tool depends on your store size, platform, and technical resources:
| Tool | Best For | Cost | Technical Skill |
|---|---|---|---|
| Google Optimize (sunset, use Optimizely free) | Basic page-level tests | Free tier available | Low |
| Shoplift | Shopify native A/B testing | $149/mo | Low (visual editor) |
| VWO | Full experimentation suite | $199/mo | Medium |
| Optimizely Web | Enterprise experimentation | Custom ($1k+/mo) | Medium-High |
| Convert.com | Privacy-focused testing | $249/mo | Medium |
| Shopify native experiments | Price testing, template testing | Included with Shopify | Low |
For Shopify stores under $1M annual revenue, Shoplift or Shopify’s native experiments cover most testing needs. Stores running complex multi-page experiments or needing server-side testing should evaluate VWO or Convert.com. For platform context, see our how to sell on Shopify guide.
How Do I Build a Testing Roadmap?
Random testing wastes time. A structured roadmap prioritizes tests by expected impact and effort:
The ICE scoring framework
Score each test idea on three dimensions (1 to 10 scale):
- Impact: How large is the expected conversion lift? Product page hero image = high impact (8). Footer link color = low impact (2).
- Confidence: How sure are you the test will produce a measurable result? Data-supported hypotheses (analytics shows 70% of users abandon at shipping reveal) = high confidence (8). Gut-feel hypotheses = low (3).
- Ease: How quickly and cheaply can you implement the test? Button color change = easy (9). Full checkout redesign = hard (3).
Average the three scores. Run tests in ICE-score order, highest first. Most ecommerce stores can run 2 to 4 tests per month with this approach.
The testing calendar
Plan 3 months ahead. Each month has 2 to 4 test slots depending on traffic. Don’t run tests that compete for the same page simultaneously (two product page tests confound each other). Stagger by page: month 1 tests product page, month 2 tests checkout, month 3 tests homepage and category pages. For measurement depth, see our ecommerce KPIs guide.
What Are the Most Common A/B Testing Mistakes?
Ending tests too early
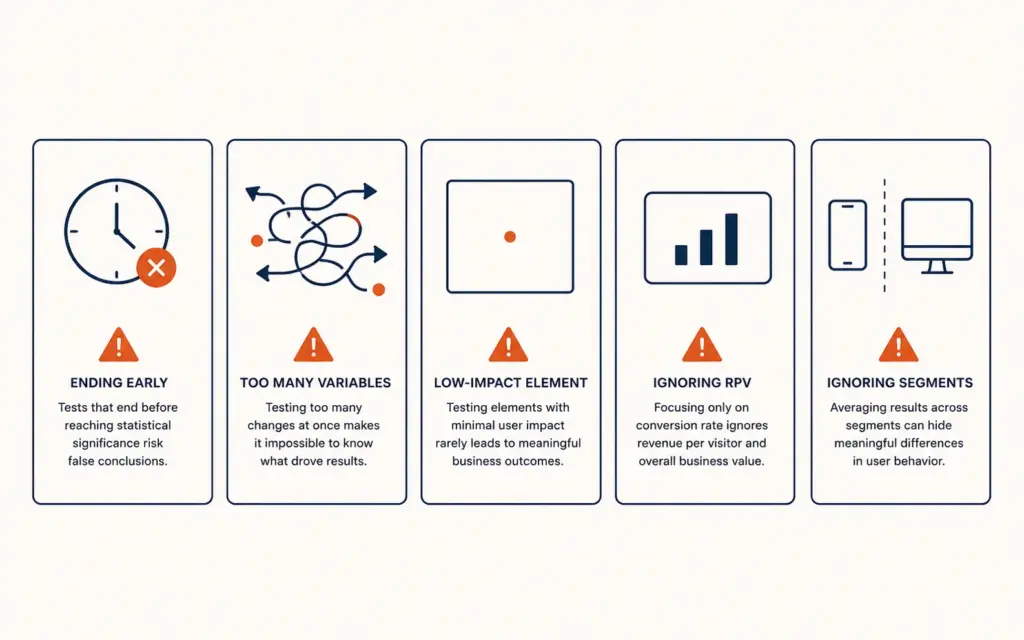
The most damaging mistake. A test showing “15% lift” after 3 days and 40 conversions is statistically meaningless. Early results are dominated by noise, not signal. Commit to running every test until it reaches 95% significance OR you’ve exceeded the maximum reasonable test duration (typically 28 days). Never implement a change based on sub-significant results.
Testing too many elements at once
If you change the headline, image, CTA text, and layout simultaneously, and conversion improves 10%, you don’t know which change caused the improvement. Worse, some changes might have helped while others hurt, with the net effect masking both. Test one element at a time. Multivariate testing (MVT) handles multiple variables but requires 10 to 50x more traffic.
Testing low-impact elements
Testing button border radius or font size on a footer link produces tiny, statistically insignificant results even with massive traffic. Focus on high-impact elements: what the visitor sees above the fold, what happens at the moment of purchase decision, and what causes abandonment. Use analytics to identify the biggest drop-off points, then test solutions for those specific problems. For analytics depth, see our GA4 ecommerce setup guide.
Not accounting for revenue per visitor
Conversion rate alone doesn’t tell the full story. A variation might lower conversion rate 5% but increase AOV 20%, producing higher revenue per visitor. Always measure revenue per visitor (RPV) alongside conversion rate. The winning variation is the one that maximizes RPV, not just conversion rate. For pricing impact, see our ecommerce pricing strategy guide.
Ignoring mobile vs desktop segments
A test might show “no significant difference” in aggregate but hide a 15% lift on mobile and a 10% decline on desktop that cancel out. Always segment results by device type. If a variation wins on mobile (60 to 75% of your traffic) and loses on desktop, implement it for mobile only using responsive logic.
Frequently Asked Questions
A/B testing (split testing) compares two versions of a page, element, or flow to measure which drives more conversions or revenue. Traffic splits randomly between the control (original) and variation (changed version). Statistical analysis determines whether the difference in performance is real or random noise. Ecommerce stores use A/B testing on product pages, checkout flows, pricing, CTAs, email subject lines, and mobile layouts to compound incremental improvements over time.
Most ecommerce A/B tests require 1,000 to 5,000 visitors per variation and at least 100 conversions per variation to reach 95% statistical significance. At a 2% conversion rate wanting to detect a 20% relative improvement, you need approximately 5,000 visitors per variation. Stores with fewer than 10,000 monthly visitors should run fewer, higher-impact tests rather than multiple simultaneous experiments.
Run every test for at least 14 days to capture weekday and weekend behavior patterns, and until it reaches 95% statistical significance. Most ecommerce tests require 14 to 28 days. Never end a test early because one variation “looks like it’s winning.” Early results are dominated by random noise. The maximum test duration before calling it inconclusive is typically 28 to 42 days.
Shoplift ($149/month) is the leading Shopify-native A/B testing tool with visual editor and theme integration. Shopify’s built-in experiments handle price testing and template comparisons at no additional cost. For stores above $1M annual revenue needing server-side testing, VWO ($199/month) and Convert.com ($249/month) offer fuller experimentation suites. Start with Shopify native experiments before investing in paid tools.
Start with the highest-traffic, highest-intent page: your product page. Test the hero image format (lifestyle vs white-background), CTA button text and color, and social proof placement. These three tests consistently produce the largest conversion impact. After product page testing, move to checkout optimization (field count, payment methods, shipping threshold display). Use analytics to identify your biggest drop-off points and test solutions for those specific problems first.
Statistical significance at 95% confidence means there’s only a 5% probability that the observed difference between control and variation happened by random chance. It does not mean the variation is 95% “better.” Reaching significance requires enough data (visitors and conversions) that the pattern is unlikely to be noise. Most A/B testing tools calculate significance automatically. The standard threshold for ecommerce testing is 95% confidence with 80% statistical power.
Related Reads
- Product Page Design Guide
- Cart Abandonment Solutions
- Discount Strategy Guide
- Ecommerce KPIs Guide
- GA4 Ecommerce Setup
- Ecommerce Pricing Strategy
Enjoying this? Get more like it every week.
One email per week with ecommerce strategies, tool picks, and seller insights. No spam.