- Best selling products research is a multi-source process, not a single tool or list.
- Demand data without margin and competition data leads to bad buying decisions.
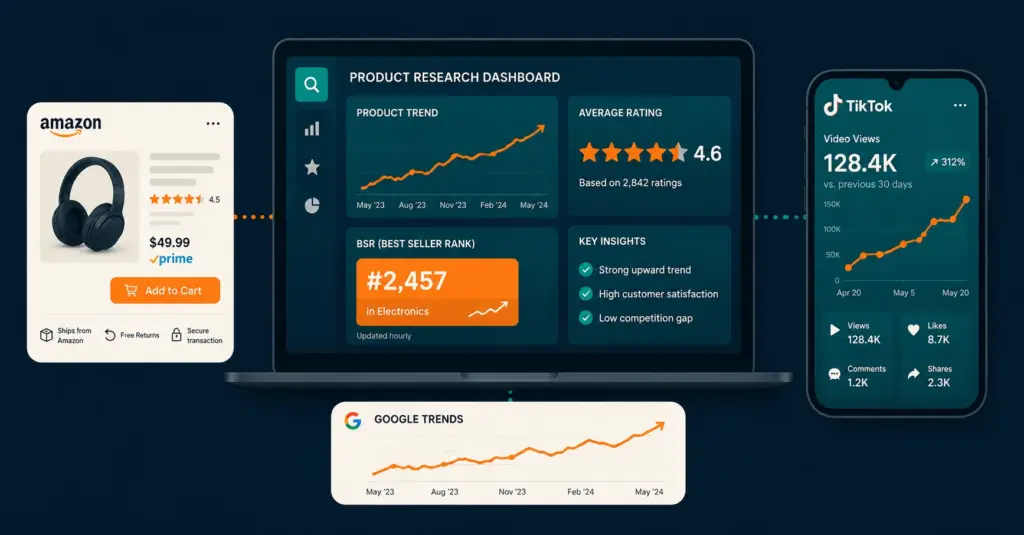
- Combining Amazon BSR, Google Trends, TikTok signals, and social listening gives the clearest picture.
- Always validate demand with a low-cost test before committing to significant inventory.
Best selling products research is the process of identifying items with proven demand, healthy profit margins, and manageable competition before you invest time or money. Done well, it combines data from multiple platforms, including Amazon, Google Trends, TikTok, and social listening tools, into a single decision framework rather than a gut-feel product list.
Most guides stop at a list of trending items and call it done. That leaves out the hard part: figuring out whether a product can actually make you money, or whether you’re walking into a niche already packed with cheaper suppliers and bigger ad budgets. This guide covers the full workflow, from spotting demand signals to calculating realistic margins, scoring competitive saturation, and running a low-cost validation test before any real inventory commitment. If you’re still deciding what type of business to build around your products, the overview at ecommerce business models is a good place to anchor your thinking first.
What makes a product worth researching in the first place?
Not every product with sales volume is worth your attention. A product worth researching has three things at once: real and measurable demand, a price point that supports a margin after costs, and a competitive landscape you can realistically enter. Miss any one of those, and the research process becomes an exercise in optimism rather than analysis.
Demand means people are actively searching for or buying the item right now, not just that it appeared on a “trending products” roundup published six months ago. Margin means the difference between your all-in landed cost (product, shipping, duties, platform fees, returns) and your selling price covers your ad spend and still leaves a profit. Competition means the number and quality of existing sellers at your target price point gives you a realistic path to visibility.
The products most worth your research time tend to cluster in a few broad categories. Physical goods with consumable or repeat-purchase components keep customers coming back. Items that solve a specific, articulated problem generate organic search traffic because people describe that problem in search queries. Niche products with a passionate, reachable community tend to have lower ad costs because organic and word-of-mouth channels remain viable. And products where the top listings have obvious weaknesses in photography, copy, or reviews give you a clear path to out-executing incumbents.
If you’re newer to the sourcing side of this, reading up on high demand low competition products before diving into the research methodology will help you calibrate what “winnable” actually looks like.
How do you use Amazon BSR data without misreading it?
Amazon’s Best Seller Rank (BSR) is one of the most actionable free data sources available for product research, but it gets misread constantly. BSR is a relative rank within a category, updated hourly, based on recent sales velocity. A BSR of 500 in Kitchen & Dining means something very different from a BSR of 500 in a subcategory like “Silicone Baking Mats.”
The right way to use BSR is to look at the spread across the top 10 to 20 listings in a subcategory, not just the single best seller. If listings ranked 5 through 15 all have BSRs under 3,000, the subcategory has strong sustained demand across multiple sellers. If only the first one or two listings have strong BSRs and the rest fall off sharply, demand is concentrated and you’ll have a harder time gaining traction.
Pair BSR with review count and review velocity. A product with 8,000 reviews and a BSR of 400 is a very different competitive situation from one with 200 reviews and a BSR of 400. The first is entrenched, meaning you’d need significant launch resources to compete. The second suggests the category is growing and new entrants can still build review counts quickly. Tools like Jungle Scout and Helium 10 surface both BSR history and review velocity in one dashboard, which saves significant manual work. For a deeper walkthrough of how to use Amazon’s platform as a research environment beyond just BSR, see the Amazon FBA guide.
One BSR mistake worth avoiding: looking at BSR on a single day. A product spiking after a lightning deal or influencer mention will show a temporarily inflated rank. Always check BSR history over 30 to 90 days to confirm the rank reflects genuine sustained demand rather than a short promotion window.
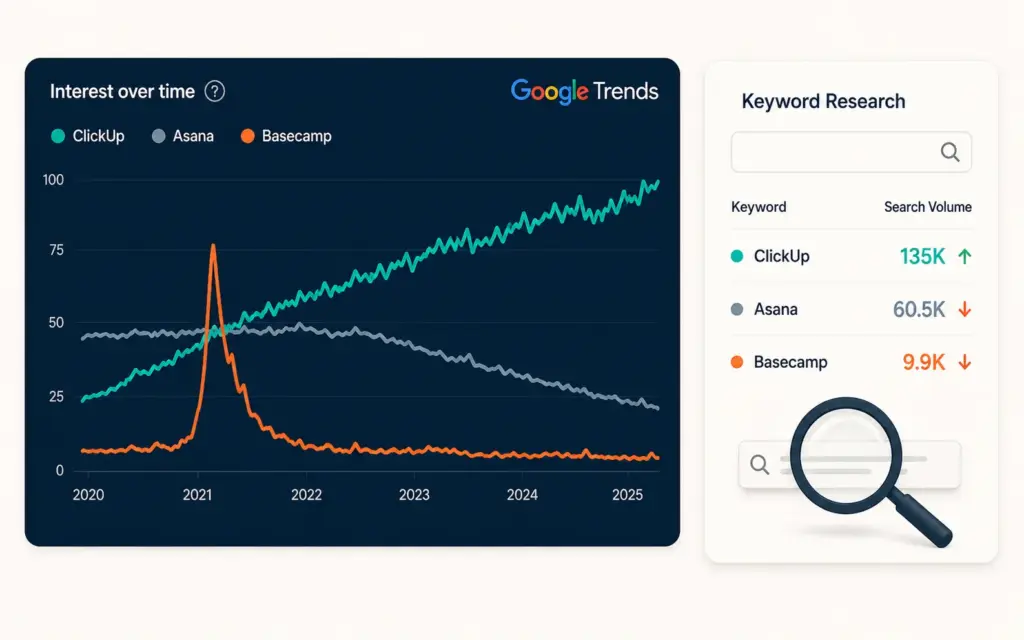
How do Google Trends and search data improve your product research?
Amazon BSR tells you what’s selling on Amazon. Google Trends tells you whether interest in the broader topic is growing, shrinking, or flat across the internet. Those two signals together are more useful than either one alone.
A product trending upward on Google Trends but not yet reflected in Amazon’s top sellers is a potential early-mover opportunity. A product with strong Amazon BSR but declining Google search interest suggests the trend may be peaking, and entering now means competing on a category that could soften over the next 12 months. Flat Google Trends with steady BSR usually indicates a stable evergreen category, which is often the most reliable place to build a long-term business.
For keyword-level demand data, Google Keyword Planner and tools like Ahrefs or Semrush give you monthly search volumes for specific product queries. Focus on mid-tail keywords, those with 1,000 to 30,000 monthly searches, rather than head terms. The head terms (“running shoes,” “phone case”) are dominated by brands with massive domain authority. The mid-tail terms (“waterproof running shoes for wide feet,” “clear MagSafe phone case for iPhone 15”) often have enough volume to matter and enough specificity to be winnable.
Cross-reference your keyword list against what’s actually ranking in organic search. If the top results are all major retail sites, SEO-led organic traffic for that product term is going to be hard to capture. If you see blogs, YouTube reviews, and smaller stores ranking, there’s a viable content angle. The ecommerce technical SEO guide covers how to build the infrastructure that makes product and category pages rank, once you’ve identified the right keywords through your research.
What role does TikTok and social listening play in product research?
TikTok has become one of the earliest indicators of emerging product demand, often 3 to 6 months before trends show up clearly in search volume or Amazon BSR data. That lead time is the value. Products that are going viral on TikTok today tend to generate their highest Amazon search volume 2 to 4 months later, and if you can identify them during the TikTok signal stage, you have time to source, list, and build a position before the category gets crowded.
The most useful TikTok signals are engagement rate relative to views (a video with 500,000 views and 80,000 likes signals stronger intent than one with 2 million views and 30,000 likes), comment sentiment (people asking “where can I buy this?” is the clearest commercial signal possible), and hashtag search volume within TikTok’s own search bar. TikTok’s creative center also shows trending products and top-performing ad creatives filtered by category and region. For a fuller breakdown of how to use TikTok as both a research and sales channel, the TikTok shop strategy guide covers the commerce side in detail.
Beyond TikTok, Reddit and Pinterest are underused research tools. Reddit’s community search across subreddits related to your potential niche surfaces real language people use to describe problems and products. That language becomes your product copy and your keyword list. Pinterest’s trending section is particularly good for seasonal and home goods categories. Social listening tools like Brandwatch or even free alternatives like Google Alerts set to product-related phrases can catch emerging demand before it shows up in structured data.
The combination that works best: TikTok for early trend signals, Reddit for problem language and community depth, Pinterest for visual and seasonal demand, and Google Trends to confirm whether those social signals translate into search behavior. According to Exploding Topics research, the gap between a product going viral on social media and peak search demand can be as short as 4 weeks in fast-moving categories like beauty and fitness, which means speed of validation matters as much as accuracy of research.
How do you score competitive saturation to avoid oversaturated niches?
Demand research tells you whether people want a product. Saturation scoring tells you whether you can profitably compete for those buyers. These are separate questions, and confusing them is the reason many sellers invest in products that technically have demand but yield no profit because they can’t win visibility without spending more on ads than the margin allows.
A simple saturation score combines five factors: number of sellers already active in the subcategory, the average review count of the top 10 listings, the price compression in the category (are most sellers clustered within a 10% price band?), the share of sponsored listings on page one (more than 70% means organic visibility is expensive), and whether private label or brand-registered sellers dominate (they have listing protection advantages you won’t have at launch).
Score each factor on a 1 to 5 scale where 1 means heavy saturation and 5 means open market. A combined score of 18 or higher out of 25 suggests a category worth pursuing. A score under 12 means competitive headwinds will likely eat your margins before you establish traction.
Pay particular attention to categories where a single brand has 40% or more of page-one real estate. Price-matching them is usually impossible because they have volume advantages in sourcing. Differentiating away from them on product features or positioning requires a clear product development reason, not just better packaging. For thinking through how your cost structure needs to work before entering a competitive category, the ecommerce profit margins guide has the full unit economics breakdown.
Which product research tools are actually worth using?
The product research tool market is crowded, and a lot of tools surface the same underlying data with different interfaces. The ones that consistently add value map to specific jobs in the research workflow rather than claiming to do everything.
For Amazon-specific research, Jungle Scout and Helium 10 remain the most comprehensive. Jungle Scout’s Opportunity Finder is particularly good at surfacing subcategory demand gaps. Helium 10’s Black Box lets you filter by estimated monthly sales, review count, and BSR range simultaneously, which speeds up the saturation scoring process significantly. Both have paid tiers, but both also have free features that cover the basics for early-stage research.
For cross-platform trend research, Google Trends is free and irreplaceable. Exploding Topics surfaces emerging search trends before they peak. Treendly is a lower-cost alternative with good visualization for long-cycle trend tracking.
For keyword research and competitive SEO analysis, Ahrefs and Semrush are the standard tools. For most early-stage sellers, Semrush’s free tier plus Google Search Console data covers enough ground to make informed decisions without a paid subscription in the first 6 months.
For social listening, TikTok Creative Center (free), Reddit search, and Pinterest Trends (free) cover the social signal layer without additional cost. Paid tools like Brandwatch or Sprout Social add value at scale but are unnecessary for initial product validation research.
One category worth noting: AI tools for ecommerce are increasingly useful for synthesizing research across platforms, generating product positioning angles from customer review analysis, and identifying content gaps in competitive categories. The time savings on manual research compilation alone can justify adoption even for small operations.
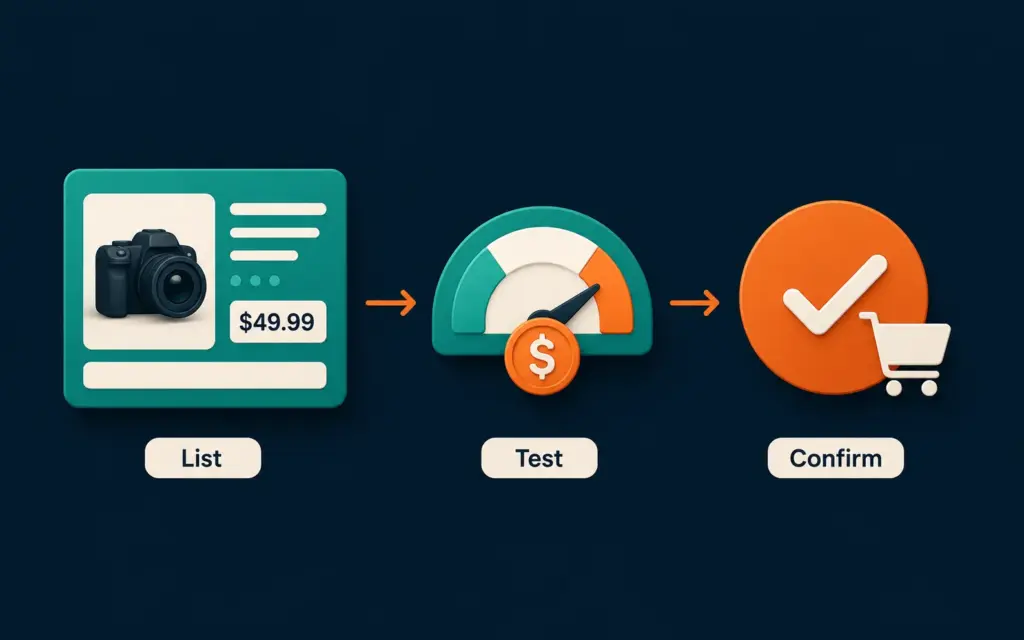
How do you validate a product idea before investing in inventory?
Validation separates product research from product buying. The goal is to confirm that real buyers will pay your target price for your specific version of a product, without committing to inventory you can’t return. There are several methods, and the right one depends on your category and resources.
The fastest validation method for physical products is a pre-sale listing. Create a product listing on your store or marketplace with real photos, accurate pricing, and a shipping window of 3 to 4 weeks. Drive targeted traffic via a small paid ad budget ($50 to $200) or organic social post to an engaged audience. If you get purchases, demand is real. If click-through rates are strong but no one converts, your price or positioning needs adjustment. If click-through rates are weak, the product itself may not resonate. The digital product launch checklist covers the validation framework in detail for the digital side of this, and many of the same principles apply to physical goods.
A second method is competitive analysis of customer reviews. Specifically, read the 2 and 3-star reviews on the top-selling listings in your target category. These reviews almost always contain a list of product failures your potential customers are willing to pay more to avoid. If you can source a product that solves the most commonly cited problems, you have a positioning advantage built directly from market data rather than guesswork.
A third method is a small test order, 50 to 100 units from a supplier, sold through a single channel at your target price before committing to a full purchase order. This is more expensive than a pre-sale but gives you real fulfillment and customer experience data. According to Shopify’s business research, sellers who run even minimal validation tests before major inventory purchases report significantly lower rates of dead stock.
For those considering dropshipping as a lower-risk validation path before taking on inventory, the comparison at dropshipping vs ecommerce breaks down where each model makes sense in a product research and validation context.
What are the best selling product categories to research right now?
Rather than a static list that dates quickly, the most useful frame here is category types that consistently outperform over time, combined with the characteristics that make them more defensible.
Health and wellness continues to be the most durable high-volume category across platforms, particularly items at the intersection of at-home convenience and clinical-adjacent outcomes (sleep aids, portable fitness, recovery tools, personal monitoring devices). The challenge is that this category attracts well-funded competitors fast, so differentiation needs to be specific and grounded in a real product difference rather than just branding.
Home organization and storage products have had sustained demand for years and benefit from strong visual discovery on Pinterest and TikTok. The best opportunities tend to be in subcategories that solve a newly created problem, like organization systems for specific consumer electronics or modular storage for smaller living spaces.
Pet products, particularly for dogs and cats, show consistent year-over-year growth and have a loyal, vocal community of buyers willing to pay premium prices for quality. Review counts in the top listings can be high, but subcategories like enrichment toys, travel gear, and health-adjacent accessories often have more open competitive landscapes.
Outdoor and activity gear, particularly items tied to micro-activities (specific sports or hobbies with dedicated communities), tends to have lower advertising competition and higher average order values. Buyers in these communities research extensively and are often reachable through content and community channels without heavy paid ad dependence.
Digital products and bundled digital-physical combinations are worth noting separately. Margins are fundamentally different when there’s no physical inventory, and the research methodology overlaps with physical products but diverges on the validation side. The resource at digital products to sell covers that side of the market specifically, and if you’re weighing the two, the what to sell online guide helps frame the decision.
How do you build a repeatable product research workflow?
Ad hoc research produces inconsistent results. A structured workflow produces a shortlist of candidates you can evaluate objectively rather than ones you’re excited about subjectively. The two-week workflow below is the one that consistently surfaces the most actionable candidates.
Week one covers demand identification. Pull 20 to 30 candidate products from Amazon BSR browsing, Google Trends, TikTok Creative Center, and one subreddit relevant to your category. Record each with: estimated monthly search volume, BSR range of top 10 listings, average review count of top 10 listings, and price range of page-one results. Don’t filter yet, just collect.
Week two covers scoring and validation preparation. Apply your saturation score to each candidate. Eliminate anything scoring below 12. For the remaining candidates, calculate a rough unit economics estimate: supplier quote + shipping + duties + platform fees + estimated return rate against your target selling price. Eliminate anything with gross margin below 35% at your target price. Whatever remains goes to a validation test: a pre-sale listing, a small ad spend test, or a 50-unit test order depending on your available budget.
Build this workflow into a repeatable calendar process, not a one-time event. The best ecommerce operators run continuous product research as an ongoing function, not a launch-time exercise. Connecting your product research to your broader marketing and retention strategy from the start also pays off later. Understanding what you’re selling and why customers choose it makes ecommerce customer retention much easier to execute, because product-market fit drives repeat purchase naturally rather than through discounting alone.
For sellers working across multiple channels, tools that centralize product data and inventory decisions also reduce research complexity significantly. The overview at multi-channel ecommerce covers how to manage product listings and demand signals across platforms without doubling your workload, and the inventory sync tools guide addresses the operational side of executing across channels once you’ve identified winning products.
Frequently Asked Questions
You can do solid foundational research with entirely free tools. Amazon’s own best seller pages and “Movers & Shakers” lists are free. Google Trends is free. TikTok Creative Center is free. Pinterest Trends is free. Reddit search is free. The limitation of free-only research is speed and historical data depth, not accuracy. You’ll spend more time manually collecting what paid tools surface automatically, but the underlying data is available without a subscription. Start with free tools, and invest in a paid tool like Jungle Scout or Helium 10 only once you’re actively listing products and need the time savings.
The clearest signal is Google Trends history over 2 to 5 years. A long-term trend shows gradual upward movement or consistent flat demand with seasonal peaks. A fad shows a sharp spike followed by an equally sharp decline. Crosscheck against Amazon BSR history: if the category’s top sellers have maintained similar BSR levels across 12 months rather than spiking briefly, demand is structural. Products solving persistent problems (sleep, organization, pet care, fitness) are far more likely to hold long-term than products tied to a single viral moment or media cycle.
By volume, the consistently highest-selling categories on Amazon are Electronics, Home & Kitchen, Beauty & Personal Care, Clothing Shoes & Jewelry, and Health & Household. However, volume does not equal opportunity. These are also the most competitive categories. The better question for a new or growing seller is which subcategories within those large categories have strong demand, moderate review counts on top listings, and price points that support healthy margins. Subcategory research within large categories almost always uncovers better entry points than trying to compete at the top-level category.
A pre-sale listing with a small paid traffic test is the fastest method. Create a real product page with accurate pricing and a realistic shipping window. Drive $50 to $150 in targeted traffic via Facebook or TikTok ads, or an organic post to a relevant community. Track click-through rate, add-to-cart rate, and actual conversion rate. If people buy or nearly buy, demand is real and you can proceed to sourcing. If not, you’ve spent a small amount to learn something that would have cost significantly more to discover after purchasing inventory. The entire test can run in 5 to 10 days.
Research 20 to 30 candidates at the initial identification stage, then apply your scoring criteria to narrow to 5 to 8 finalists, then run validation on your top 2 to 3. Trying to validate too many products at once spreads attention and budget too thin and produces inconclusive results. Starting with fewer than 20 candidates at the identification stage risks confirmation bias, where you find reasons to pursue the first product that seems promising rather than comparing it against alternatives objectively. The two-week workflow described in this guide produces a shortlist that is workable without being overwhelming.
Yes, and international markets often present less competitive conditions for products that have already proven demand in the US. Amazon has marketplace-specific BSR data for the UK, Germany, Canada, Japan, and others, accessible through Jungle Scout and Helium 10 with region filters. Google Trends lets you filter by country, so you can see whether a trend that peaked in the US is still growing in Europe or Southeast Asia. The main additional considerations are import duties, local consumer preferences, platform choice (many international markets have dominant local platforms beyond Amazon), and shipping cost implications for your margin model. The selling internationally in ecommerce guide covers the logistics and platform side of international expansion.
Related Reads
- How to Find High Demand Low Competition Products
- What to Sell Online: A Practical Decision Framework
- Ecommerce Business Models Explained
- Dropshipping vs Ecommerce: Which Model Is Right for You?
- Amazon FBA Guide: How to Start and Scale
- How to Calculate and Improve Ecommerce Profit Margins
- AI Tools for Ecommerce: What’s Actually Worth Using
- Digital Products to Sell Online in 2026
- TikTok Shop Strategy: How to Sell on TikTok
- Multi-Channel Ecommerce: How to Sell Everywhere
Enjoying this? Get more like it every week.
One email per week with ecommerce strategies, tool picks, and seller insights. No spam.