
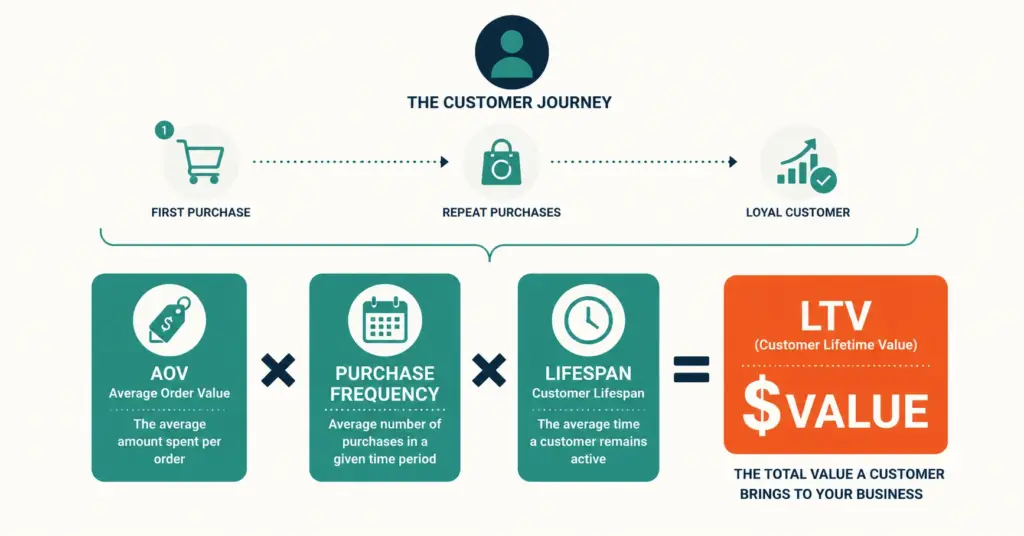
- Customer lifetime value (LTV or CLV) is the total revenue or profit a customer generates over their entire relationship with your brand. The basic formula: Average Order Value x Purchase Frequency x Customer Lifespan. LTV determines how much you can afford to spend acquiring each customer and whether your growth strategy is sustainable.
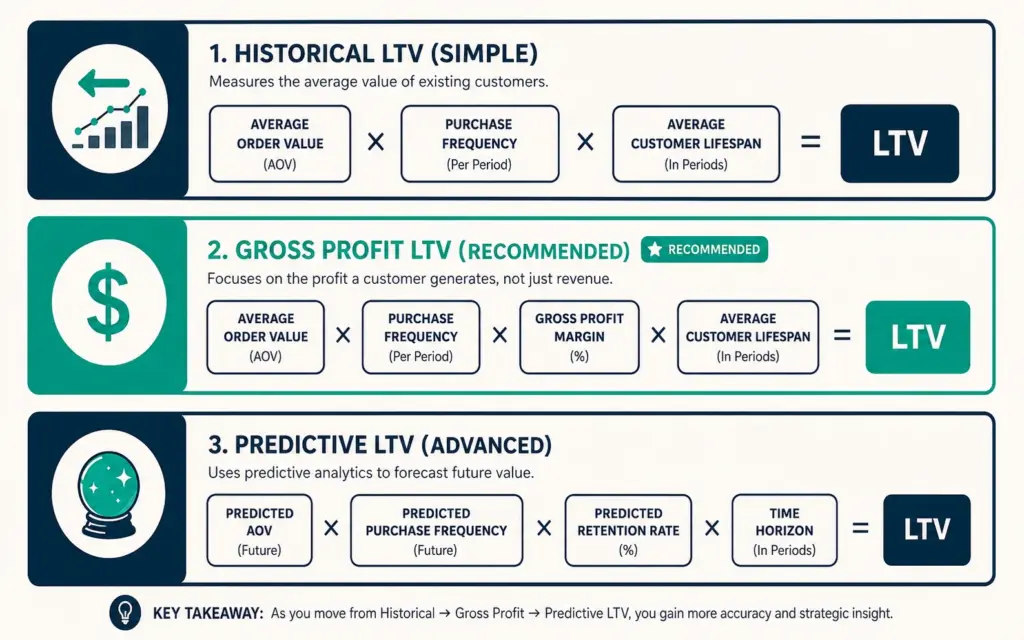
- Three LTV formulas serve different purposes: historical LTV (backward-looking, based on actual purchase data), predictive LTV (forward-looking, models future behavior), and gross profit LTV (most useful for business decisions because it accounts for margin, not just revenue).
- Ecommerce LTV benchmarks: fashion $150 to $300, beauty $200 to $500, supplements $300 to $800 (subscription effect), electronics $100 to $250, food/beverage $150 to $400. Subscription brands consistently show 2 to 3x higher LTV than single-purchase brands in the same category.
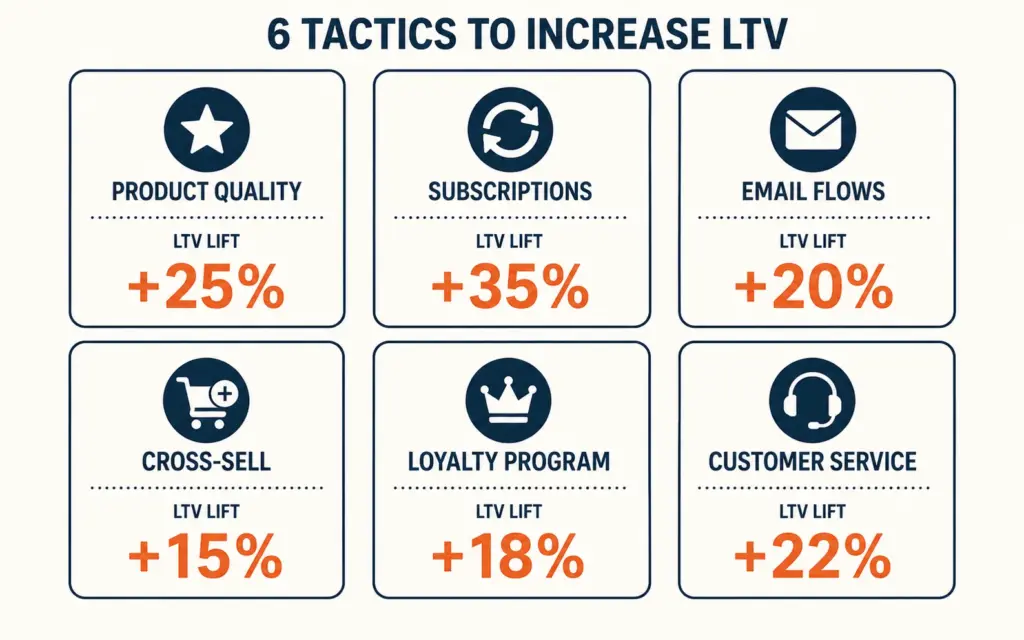
- The 6 tactics that increase LTV: improve product quality (reduces churn), launch subscription options (2 to 3x LTV lift), build post-purchase email flows (increase repeat rate 20 to 40%), cross-sell complementary products, create loyalty programs, and improve customer service response time.
Lifetime value calculation for ecommerce measures the total revenue or profit a single customer generates across every order they place with your store over the entire duration of their relationship. A customer who buys once for $50 has a different value than one who buys 6 times over 3 years totaling $340. LTV quantifies that difference and turns it into the most important input for acquisition budgeting, retention investment, and growth planning. According to Harvard Business Review’s customer value research, increasing customer retention by just 5% lifts profits 25 to 95% because retained customers cost nothing to re-acquire and spend more per order over time.
LTV is also the metric that makes or breaks your customer acquisition strategy. A $50 CAC is cheap if LTV is $300 (6:1 ratio, highly profitable). The same $50 CAC is disastrous if LTV is $55 (1.1:1 ratio, barely covering costs). Without knowing LTV, every acquisition budget is a guess. For the CAC side of this equation, see our customer acquisition cost guide.
This guide covers the three LTV formulas (historical, predictive, profit-based), benchmarks by product category, the relationship between LTV and growth decisions, and the 6 tactics that increase LTV 25 to 50%.
How Do I Calculate Customer Lifetime Value?
Formula 1: Historical LTV (simplest)
Historical LTV = Average Order Value x Average Purchase Frequency x Average Customer Lifespan
Example: $60 AOV x 2.5 orders per year x 3 years = $450 LTV
Pull these inputs from your ecommerce platform: Shopify reports AOV under Analytics > Reports. Purchase frequency = total orders / total unique customers over the measurement period. Customer lifespan = average time between a customer’s first and last purchase (for active businesses, use 2 to 3 years as a default if you don’t have enough historical data).
Formula 2: Gross Profit LTV (most useful for decisions)
Gross Profit LTV = Average Order Value x Gross Margin % x Purchase Frequency x Customer Lifespan
Example: $60 AOV x 50% margin x 2.5 orders/year x 3 years = $225 Gross Profit LTV
Gross profit LTV is the number you compare against CAC because it represents actual profit, not revenue. A $60 revenue LTV at 50% margin is only $30 of gross profit per order cycle. The gross profit version prevents the common mistake of setting CAC targets against revenue LTV, which overstates how much you can actually afford to spend. For margin analysis, use our profit margin calculator.
Formula 3: Predictive LTV (advanced)
Predictive LTV uses purchase history patterns to forecast future customer value. The simplified version:
Predictive LTV = (Average Monthly Revenue per Customer x Gross Margin %) / Monthly Churn Rate
Example: $15 monthly revenue x 50% margin / 5% monthly churn = $150 Predictive LTV
Predictive LTV is most useful for subscription businesses or brands with enough historical data (12+ months, 1,000+ customers) to calculate reliable churn rates. Tools like Klaviyo, Lifetimely (Shopify app), and Daasity automate predictive LTV calculation.
What is a Good LTV for Ecommerce?
| Category | Revenue LTV Range | Avg Purchase Frequency | Avg Lifespan | Subscription Effect |
|---|---|---|---|---|
| Beauty / Skincare | $200 to $500 | 3 to 5x/year | 2 to 3 years | 2 to 3x with subscription |
| Supplements / Health | $300 to $800 | 4 to 8x/year | 1.5 to 3 years | 2 to 3x with subscription |
| Fashion / Apparel | $150 to $300 | 2 to 4x/year | 2 to 3 years | Limited subscription fit |
| Food / Beverage | $150 to $400 | 4 to 10x/year | 1 to 2 years | 2 to 4x with subscription |
| Pet Products | $200 to $500 | 4 to 6x/year | 2 to 4 years | 2 to 3x with subscription |
| Electronics / Tech | $100 to $250 | 1 to 2x/year | 1 to 2 years | Low subscription fit |
| Home / Kitchen | $120 to $300 | 1.5 to 3x/year | 2 to 3 years | Moderate for consumables |
The LTV:CAC ratio benchmark
Target gross profit LTV:CAC ratio of 3:1 or better. Below 3:1, growth is marginally profitable or unprofitable. Above 5:1, you may be under-investing in acquisition (you could spend more and still maintain profitability). The 3:1 ratio means every $1 of acquisition cost generates $3 of gross profit over the customer’s lifetime. For detailed CAC benchmarks and calculation, see our customer acquisition cost guide.
How Do I Increase Customer Lifetime Value?
1. Improve product quality and experience
The most overlooked LTV lever. A product that breaks, disappoints, or underperforms creates a one-time customer. A product that exceeds expectations creates a repeat buyer. Product quality drives repeat purchase rate more than any marketing tactic. Monitor return rates, review ratings, and NPS scores as leading indicators of LTV trajectory.
2. Launch subscription options
Subscription models lift LTV 2 to 3x versus single-purchase by converting one-time buyers into recurring customers. “Subscribe and save 15%” on consumables (supplements, coffee, skincare, pet food) automates repurchase and dramatically extends customer lifespan. Tools: Recharge, Skio, or Bold Subscriptions on Shopify. Even 10 to 15% subscription adoption rates meaningfully lift blended LTV. For pricing context, see our ecommerce pricing strategy guide.
3. Build post-purchase email and SMS flows
Post-purchase flows increase repeat purchase rate 20 to 40%. The three highest-impact flows: replenishment reminders (timed to product depletion), cross-sell recommendations (complementary products 7 to 14 days after delivery), and win-back sequences (60 to 90 day lapsed customer reactivation). For email strategy, see our email marketing strategy guide. For SMS flows, see our SMS marketing guide.
4. Cross-sell and upsell strategically
Each additional product a customer buys increases switching cost and brand attachment. Customers who buy from 3+ product categories have 2 to 3x higher retention rates than single-category buyers. Product recommendations on product pages, in cart, and in post-purchase emails drive cross-category expansion. For the full playbook, see our upsell and cross-sell guide.
5. Create a loyalty or rewards program
Points-based loyalty programs increase purchase frequency 15 to 25% and average lifespan 10 to 20% among enrolled customers. According to Yotpo’s loyalty program research, loyalty members spend 67% more than non-members. Tools: Smile.io, Yotpo Loyalty, LoyaltyLion. The program cost ($50 to $300/month) is typically offset by the LTV increase within 3 months. For retention strategy, see our customer retention guide.
6. Improve customer service response time
Customers who receive fast, helpful support after a problem are more loyal than customers who never had a problem at all (the service recovery paradox). Reducing first-response time from 24 hours to under 4 hours lifts repeat purchase rates 10 to 15%. Invest in helpdesk tools (Gorgias, Zendesk) that centralize support and enable fast resolution. For tech stack context, see our ecommerce tech stack guide.
How Do I Track LTV Over Time?
LTV by cohort
Track LTV by acquisition month cohort (all customers acquired in January 2026 are one cohort). Compare 3-month, 6-month, and 12-month LTV across cohorts to identify whether LTV is improving or declining over time. Rising cohort LTV indicates improving product quality, retention, and marketing effectiveness. Declining cohort LTV signals product issues, marketing targeting drift, or competitive pressure.
LTV by acquisition channel
Customers acquired through different channels have different LTV profiles. Organic search and referral customers typically have 20 to 40% higher LTV than paid ad customers because they found you through trust-based discovery rather than a promotional trigger. Email-acquired customers (from content opt-in) often have the highest LTV because they engaged with brand content before purchasing. Track channel-level LTV to inform acquisition budget allocation. For attribution methodology, see our attribution modeling guide.
The LTV dashboard
- Blended Revenue LTV: Overall average across all customers
- Gross Profit LTV: Revenue LTV adjusted for margin (the decision-making number)
- LTV:CAC ratio: Health of acquisition economics (target 3:1+)
- LTV by cohort (3/6/12 month): Trend direction for new customer value
- LTV by channel: Which acquisition sources produce the most valuable customers
- Repeat purchase rate: Leading indicator of LTV (target 25 to 40% for DTC)
Review monthly. LTV changes slowly (it’s a lagging indicator), so monthly tracking is sufficient. For the broader analytics framework, see our ecommerce KPIs guide.
Common LTV Calculation Mistakes
Using revenue LTV to set acquisition budgets
Revenue LTV of $300 does not mean you can spend $100 on acquisition. At 50% gross margin, gross profit LTV is $150. After operating costs (15 to 25% of revenue), actual available profit for acquisition is $75 to $100. Always use gross profit LTV, not revenue LTV, for acquisition decisions. For profitability context, see our ecommerce profit margins guide.
Calculating LTV with insufficient data
A 6-month-old store calculating “3-year LTV” is extrapolating from limited data. Use conservative estimates for customer lifespan (1 to 2 years) until you have 12+ months of actual purchase history. Over-projecting LTV leads to over-spending on acquisition based on optimistic assumptions that haven’t been validated.
Treating all customers as equal
The top 20% of customers typically generate 60 to 80% of revenue. Blended LTV averages the high-value 20% with the low-value 80%, producing a number that doesn’t represent either group well. Segment LTV by customer tier (top 20%, middle 60%, bottom 20%) and by acquisition channel to make more informed decisions about where to invest retention efforts.
Ignoring churn in LTV projections
A “3-year lifespan” assumption implies the customer stays active for 3 full years. But churn is continuous: 30 to 50% of ecommerce customers never place a second order. LTV projections that ignore churn overstate actual value by 30 to 60%. Use cohort retention curves (what % of January cohort re-purchases in February, March, etc.) to build realistic churn into your LTV model. For tracking setup, see our tracking setup guide.
Frequently Asked Questions
Customer lifetime value is the total revenue or profit a customer generates across all orders placed with your store over their entire relationship. The basic formula: Average Order Value times Purchase Frequency times Customer Lifespan. A customer with $60 AOV buying 2.5 times per year over 3 years has a revenue LTV of $450. Gross profit LTV (adjusted for margin) is the more useful number for business decisions.
LTV varies by category: beauty $200 to $500, supplements $300 to $800, fashion $150 to $300, food $150 to $400, electronics $100 to $250. More important than the absolute number is the LTV:CAC ratio. Target gross profit LTV of at least 3x your customer acquisition cost. If gross profit LTV is $150 and CAC is $50, the 3:1 ratio indicates sustainable, profitable growth.
Six tactics: improve product quality (reduces churn), launch subscription options (2 to 3x LTV lift for consumables), build post-purchase email and SMS flows (20 to 40% repeat rate increase), cross-sell complementary products (increases purchase frequency), create loyalty programs (15 to 25% frequency lift), and improve customer service response time (10 to 15% repeat rate improvement from fast resolution).
LTV (Lifetime Value) and CLV (Customer Lifetime Value) are the same metric with different abbreviations. Both measure total customer value over their relationship with your brand. Some businesses distinguish between revenue LTV (total revenue) and profit CLV (total gross profit), but the terms are used interchangeably in most ecommerce contexts. Always clarify whether a stated LTV figure is revenue-based or profit-based.
Recalculate monthly using cohort-based analysis. LTV is a lagging indicator that changes slowly, so monthly tracking is sufficient. Track 3-month, 6-month, and 12-month LTV by acquisition cohort to identify trends. Rising cohort LTV indicates improving retention and product quality. Declining cohort LTV requires immediate investigation into product issues, marketing targeting, or competitive pressure.
Use gross profit LTV for all acquisition and retention decisions. Revenue LTV overstates how much you can afford to spend because it ignores product cost, shipping, and fees. A $300 revenue LTV at 50% margin is $150 gross profit LTV. Setting a $100 CAC target against $300 revenue LTV looks profitable; against $150 gross profit LTV, it leaves only $50 for operating costs. Gross profit LTV prevents over-spending.
Related Reads
- Customer Acquisition Cost
- Ecommerce KPIs Guide
- Attribution Modeling
- Customer Retention Guide
- Email Marketing Strategy
- Upsell and Cross-Sell Guide
Enjoying this? Get more like it every week.
One email per week with ecommerce strategies, tool picks, and seller insights. No spam.