

- Data-driven marketing replaces guesswork with evidence: instead of assuming which campaigns, channels, and messages work, you measure them and let the data guide where you spend. For ecommerce, this is the difference between pouring budget into channels that feel productive and directing it toward the ones actually generating profitable sales.
- The foundation is measurement infrastructure: proper conversion tracking (GA4, platform pixels), attribution that shows which channels drive sales, and clean data you can trust. Without this foundation, you're making "data-driven" decisions on unreliable numbers, which is worse than admitting you're guessing.
- The metrics that matter for ecommerce marketing: customer acquisition cost (CAC), return on ad spend (ROAS), conversion rate by channel, customer lifetime value (LTV), and the LTV-to-CAC ratio. These tell you not just what's happening but whether your marketing is profitable and sustainable.
- Data-driven marketing is a loop, not a report: measure, find what's working and what isn't, shift budget toward winners and cut losers, test new approaches, and measure again. The stores that grow efficiently run this loop continuously, compounding small evidence-based improvements over time.
Data-driven marketing is the practice of making marketing decisions based on measured evidence rather than assumptions. Instead of pouring budget into channels because they feel productive or because a competitor uses them, you measure what each channel, campaign, and message actually delivers and direct your spending toward what works. For ecommerce, where every marketing dollar can be tracked to a sale, this shift from guesswork to evidence is one of the highest-return changes a store can make. It’s the difference between marketing that feels busy and marketing that provably grows profit. According to McKinsey’s research on customer analytics, companies that use data intensively in their marketing consistently outperform peers on key growth and profitability measures.
The premise is simple: most marketing budgets contain waste that the marketer can’t see without data. Some channels generate profitable sales; others generate activity that looks like progress but doesn’t convert. Data-driven marketing surfaces the difference so you stop funding what doesn’t work and double down on what does. This guide covers building the measurement foundation, the metrics that matter, and the continuous loop that turns data into decisions. The ecommerce analytics guide covers the broader analytics picture; this focuses on applying data to marketing specifically.
The Measurement Foundation Everything Depends On
Data-driven marketing is only as good as the data underneath it. Before optimizing anything, you need measurement infrastructure you can trust:
Conversion tracking. GA4 and platform pixels (Meta, Google, TikTok) must accurately record when marketing drives a sale, including the conversion value. Broken or incomplete tracking produces confidently wrong decisions. The tracking setup guide covers implementing conversion tracking with values and enhanced conversions correctly.
Attribution. Attribution connects sales back to the marketing that drove them. This is genuinely hard, since customers touch multiple channels before buying, and different attribution models credit those touchpoints differently. You don’t need perfect attribution, but you need a consistent model you understand so you can compare channels fairly. The attribution modeling guide covers the models and their tradeoffs.
Clean, trusted data. Inconsistent tracking, duplicate events, or bot traffic corrupt your data and lead to bad decisions. Periodically validate that your numbers reconcile (do platform-reported conversions match your actual orders?). Making “data-driven” decisions on unreliable data is worse than admitting you’re guessing, because false confidence leads to bigger bets on wrong conclusions. According to Google’s marketing analytics guidance, a trustworthy measurement foundation is the prerequisite that everything else in data-driven marketing depends on. The ecommerce KPIs dashboard should draw from validated data sources you’ve confirmed are accurate.
The Marketing Metrics That Actually Matter
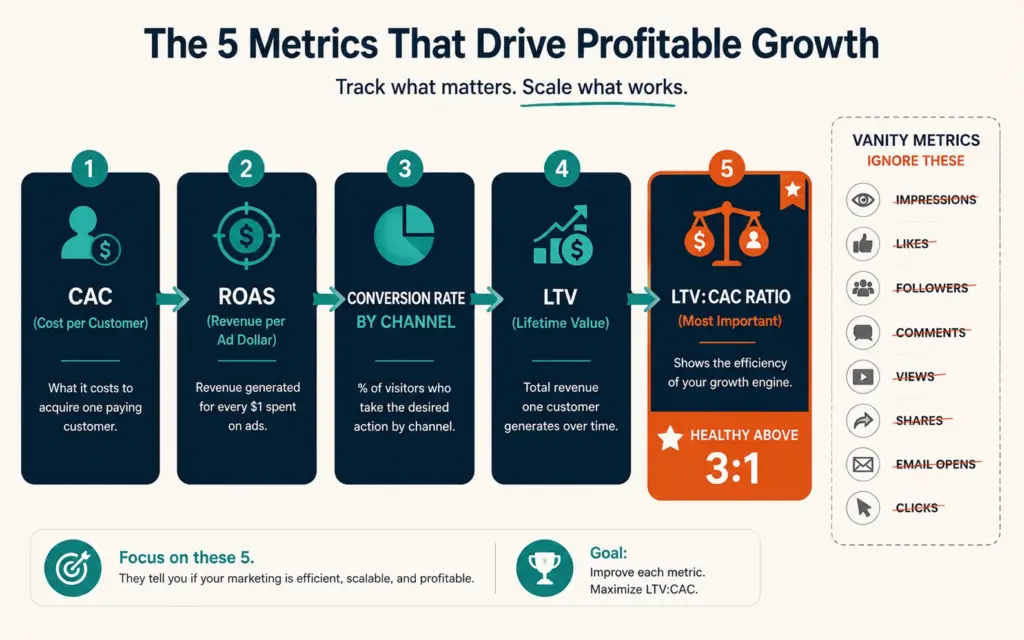
Not all metrics deserve attention. Vanity metrics (impressions, likes, follower counts) feel good and are easy to grow, but they don’t tell you whether marketing is profitable, and optimizing for them can actively distract from the metrics that determine whether the business makes money. These are the metrics that drive real decisions:
- Customer Acquisition Cost (CAC): What you spend to acquire one customer. Total marketing spend divided by customers acquired. This is the core efficiency metric.
- Return on Ad Spend (ROAS): Revenue generated per dollar of ad spend. Tells you channel and campaign efficiency. The ROAS benchmarks guide covers targets by channel.
- Conversion rate by channel: What percentage of each channel’s traffic converts. Reveals which channels send buyers versus browsers.
- Customer Lifetime Value (LTV): Total revenue a customer generates over their relationship with you. The lifetime value calculation guide covers modeling it.
- LTV-to-CAC ratio: The single most important marketing health metric. If you spend $30 to acquire a customer worth $120 over their lifetime, your 4:1 ratio is healthy. Below roughly 3:1 signals your marketing economics need work.
These metrics tell you not just what’s happening but whether your marketing is profitable and sustainable. A channel with high ROAS but customers who never return may be worse than a channel with modest ROAS and high repeat purchase rates, which is why LTV matters alongside acquisition metrics. The ecommerce customer retention data feeds your LTV calculation, connecting retention to marketing efficiency.
Segmentation: Finding the Patterns in Your Data
Aggregate numbers hide the patterns that matter. Your overall conversion rate might be 2%, but that average masks a 5% rate from returning customers and a 0.8% rate from cold social traffic. Segmentation breaks your data into meaningful groups so you can see these differences and act on them.
Useful marketing segments: by channel (which sources send your best customers), by customer type (new vs returning, high-value vs one-time), by behavior (cart abandoners, repeat buyers, lapsed customers), and by acquisition cohort (do customers acquired through a particular campaign have better retention?). The segmentation guide covers building these segments. Segmentation turns “our marketing works okay” into “this channel acquires customers with 2x the lifetime value of that channel,” which is an actionable insight you can budget around. The predictive analytics tools can extend segmentation into forecasting which customers are likely to churn or which are worth the most, sharpening your targeting.
Testing: Turning Assumptions Into Evidence
Data-driven marketing replaces “I think this works” with “we tested this and it works.” A/B testing is the core method: run two versions (of an ad, email, landing page, or offer) and measure which performs better with real customers. The A/B testing ecommerce guide covers running valid tests.
Test the decisions that matter: ad creative and copy, email subject lines and content, landing page layouts, offers and discounts, and audience targeting. Each test converts an assumption into evidence, and the evidence compounds: over time, your marketing is built on a stack of things you’ve proven work rather than things you hope work. The discipline is to test one meaningful variable at a time, run tests long enough to reach reliable conclusions, and act on the results even when they contradict your intuition, which is precisely when testing is most valuable. The email marketing strategy and Facebook ads for ecommerce both benefit directly from systematic testing.
The Data-Driven Marketing Loop
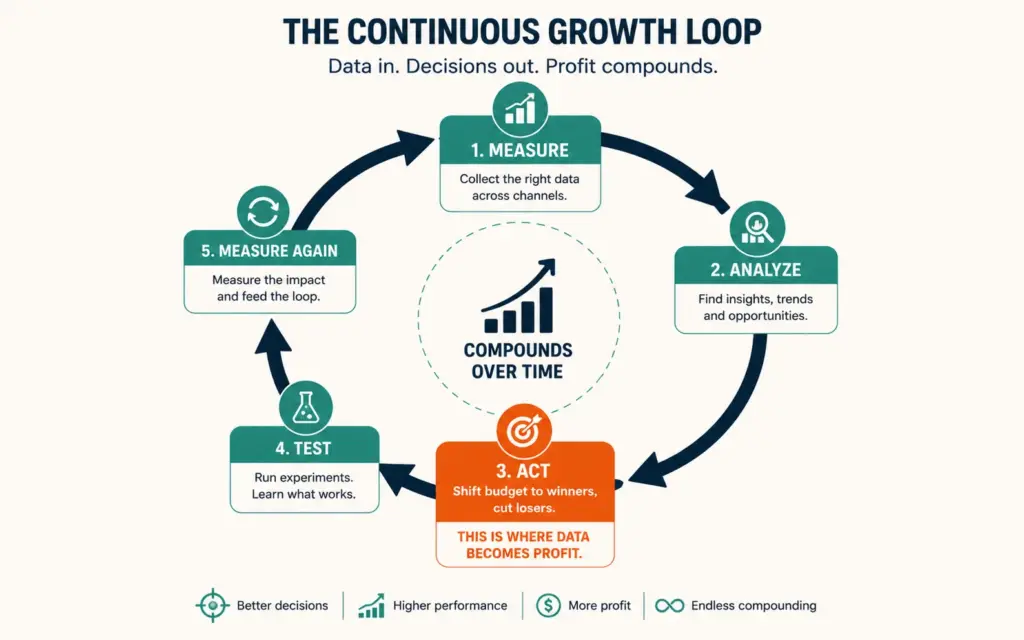
Data-driven marketing isn’t a report you read once; it’s a loop you run continuously:
- Measure: Track your marketing metrics across channels and campaigns with trusted data.
- Analyze: Find what’s working (profitable channels, high-converting campaigns) and what isn’t (money-losing channels, weak campaigns).
- Act: Shift budget toward winners, cut or fix losers. This is where data becomes profit. The act step is where most of the value lives and where discipline matters most, because it often means cutting a channel you have an emotional attachment to or that felt like it was working, on the strength of numbers that say otherwise.
- Test: Try new approaches, creative, and offers to find the next improvement.
- Measure again: Confirm your changes worked and start the loop over.
The stores that grow efficiently run this loop continuously, compounding small evidence-based improvements. The compounding is the whole point: no single iteration of the loop produces a dramatic result, but a marketing operation that gets a few percent more efficient every month ends the year in a fundamentally stronger position than one that set its campaigns once and left them running on assumptions. A 10% improvement in CAC this month, a better-converting landing page next month, a reallocated budget the month after, each small and evidence-based, add up to dramatically more efficient marketing over a year. The ecommerce marketing strategy that runs on this loop outperforms one that sets campaigns and forgets them, because it continuously redirects resources toward what the data proves works. Track the loop’s output in your ecommerce KPIs: watch CAC, LTV-to-CAC ratio, and blended ROAS trend over time as the measures of whether your data-driven approach is compounding.
Frequently Asked Questions
Data-driven marketing makes marketing decisions based on measured evidence rather than assumptions. Instead of funding channels because they feel productive, you measure what each channel, campaign, and message actually delivers and direct spending toward what works. For ecommerce, where sales can be tracked to their marketing source, this replaces guesswork with evidence, so you stop funding waste and double down on what provably generates profitable sales. It’s a continuous loop of measure, analyze, act, and test, not a one-time report.
The metrics that drive real decisions: Customer Acquisition Cost (CAC, what you spend per customer), Return on Ad Spend (ROAS, revenue per ad dollar), conversion rate by channel, Customer Lifetime Value (LTV), and the LTV-to-CAC ratio (the single most important health metric, healthy above roughly 3:1). Avoid vanity metrics like impressions, likes, and follower counts, which feel good but don’t tell you whether marketing is profitable. Focus on metrics that reveal profitability and sustainability, not just activity.
A measurement foundation you can trust: accurate conversion tracking (GA4 and platform pixels recording sales with values), a consistent attribution model connecting sales to the marketing that drove them, and clean, validated data. Without this foundation, you’re making “data-driven” decisions on unreliable numbers, which is worse than admitting you’re guessing because false confidence leads to bigger wrong bets. Validate that your platform-reported conversions reconcile with your actual orders before trusting the data to guide budget decisions.
The LTV-to-CAC ratio compares Customer Lifetime Value to Customer Acquisition Cost. If you spend $30 to acquire a customer worth $120 over their lifetime, your ratio is 4:1. It’s the single most important marketing health metric because it tells you whether your marketing economics are sustainable: a ratio below roughly 3:1 signals you’re spending too much to acquire customers relative to their value, while a healthy ratio means acquisition is profitable. It connects acquisition efficiency (CAC) to customer value (LTV) in one sustainability measure.
Segmentation breaks aggregate data into meaningful groups, revealing patterns the averages hide. An overall 2% conversion rate might mask a 5% rate from returning customers and 0.8% from cold traffic. Segmenting by channel, customer type, behavior, or acquisition cohort turns “our marketing works okay” into specific, actionable insights like “this channel acquires customers with twice the lifetime value of that channel.” Those insights let you shift budget toward the segments and channels that deliver your best customers rather than treating all traffic as equal.
Regular marketing often runs on intuition, habit, or imitation: you spend on channels because they feel right or competitors use them. Data-driven marketing measures what each channel and campaign actually delivers and directs spending based on that evidence. The difference is a continuous loop, measure, analyze, act, test, measure again, that compounds small evidence-based improvements over time. Instead of setting campaigns and hoping, you continuously redirect resources toward what the data proves works, producing dramatically more efficient marketing over months and years.
Related Reads
- Ecommerce Analytics
- Attribution Modeling
- ROAS Benchmarks
- Lifetime Value Calculation
- Segmentation
- A/B Testing Ecommerce
Enjoying this? Get more like it every week.
One email per week with ecommerce strategies, tool picks, and seller insights. No spam.