
- Financial planning for scaling ecommerce is the process of forecasting cash flow, budgeting inventory purchases, allocating marketing spend, and modeling growth scenarios to ensure the business has enough cash to fund expansion without running out of money. More ecommerce businesses fail from cash flow problems during growth than from lack of demand.
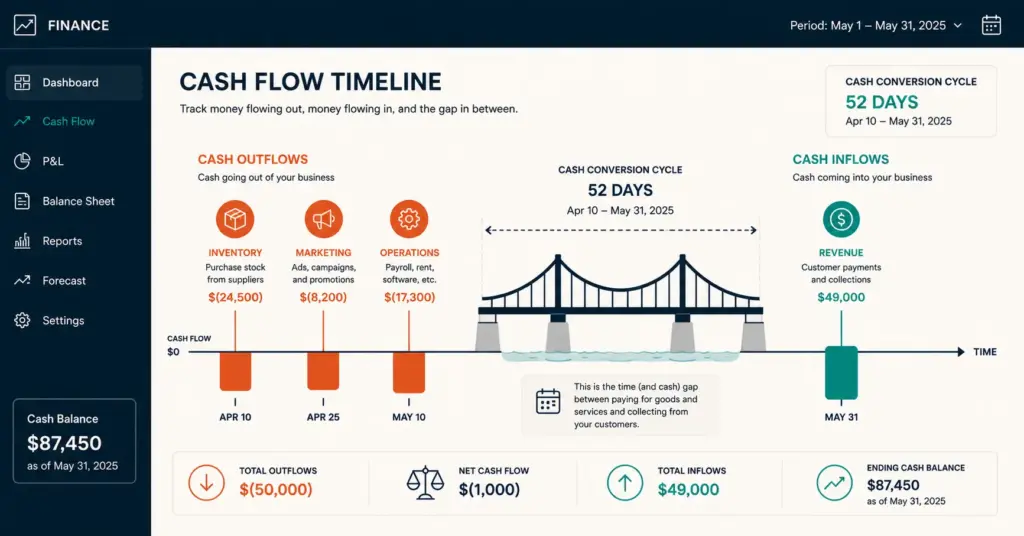
- The cash conversion cycle (time between paying for inventory and collecting customer payment) is the critical metric for scaling ecommerce. A 90-day cycle means you need 3 months of inventory investment before seeing returns. Shortening this cycle by 15 to 30 days can free $50,000 to $200,000 in working capital for a $1M annual revenue business.
- The 3 financial models every scaling ecommerce brand needs: a 12-month cash flow forecast (monthly), a unit economics model (per-product profitability), and a scenario model (best case, base case, worst case for major investments).
- The most dangerous scaling mistake is growing revenue faster than cash flow supports. A store doubling revenue from $50k to $100k/month needs $50k to $150k in additional working capital for inventory, marketing, and operations. Without that capital planned in advance, growth creates a cash crisis.
Financial planning scaling an ecommerce business is the process of forecasting cash needs, budgeting inventory and marketing spend, modeling growth scenarios, and ensuring the business never runs out of cash during expansion. The paradox of ecommerce scaling is that growth consumes cash before it generates cash. Every additional $10,000 in monthly revenue requires $5,000 to $15,000 in upfront inventory investment, increased marketing spend, and higher operational costs, all paid weeks or months before customers pay you. According to SCORE’s small business research, 82% of business failures involve cash flow problems, and ecommerce businesses with large inventory requirements are particularly vulnerable.
The brands that scale successfully don’t necessarily have more cash. They have better visibility into where cash is going and when it’s coming back. A 12-month cash flow forecast, a unit economics model per product, and scenario planning for major investments separate sustainable scaling from growth-fueled cash crises. For profitability fundamentals, see our ecommerce profit margins guide.
This guide covers the cash flow forecasting process, inventory budgeting for growth, marketing spend allocation, growth financing options, and the financial mistakes that kill otherwise-healthy scaling businesses.
Why Does Growth Create Cash Flow Problems?
The ecommerce cash flow paradox works like this:
- Month 1: You order $20,000 of inventory. Supplier payment due in 30 days. Cash out: $20,000.
- Month 2: Inventory arrives. You spend $5,000 on marketing to sell it. Cash out: $25,000 total. Revenue starts trickling in. Cash in: $8,000.
- Month 3: Revenue ramps to $15,000. But you need to reorder inventory for Month 4. Cash out: another $20,000. Net cash position: negative $22,000.
- Month 4 to 6: Revenue grows to $30,000/month. But each growth increment requires more inventory, more marketing, and more operational spend upfront.
The faster you grow, the more cash you consume before the cycle pays back. A business growing 20% monthly needs 3 to 5 months of forward inventory investment at all times. This is why profitable businesses run out of cash during their best growth periods.
The cash conversion cycle
The cash conversion cycle (CCC) measures the number of days between paying for inventory and collecting customer payment:
CCC = Days inventory outstanding + Days sales outstanding – Days payable outstanding
Example: You hold 60 days of inventory, customers pay immediately (0 days outstanding for DTC), and your supplier gives 30-day payment terms. CCC = 60 + 0 – 30 = 30 days. Every dollar invested in inventory ties up cash for 30 days. For a business with $100,000 in monthly inventory purchases, a 30-day CCC means $100,000 is always locked in the cycle. Shortening CCC by 15 days frees $50,000 in working capital.
What Financial Models Does a Scaling Ecommerce Brand Need?
Model 1: 12-month cash flow forecast
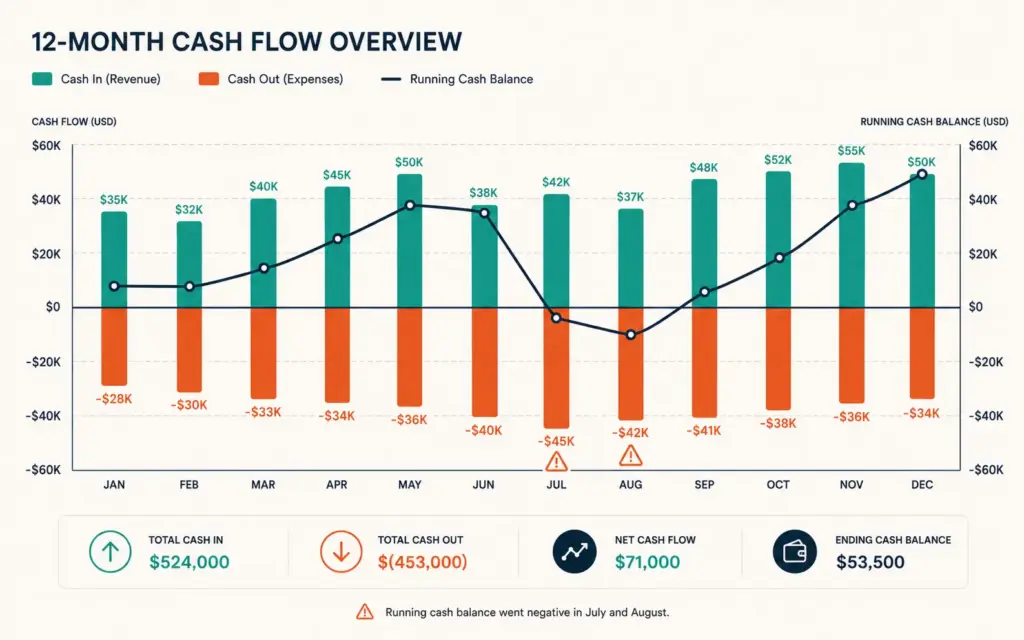
A monthly projection of all cash in (revenue, financing, other income) and all cash out (inventory, marketing, payroll, rent, software, shipping, taxes, loan payments). The forecast shows your projected cash balance at the end of each month. If any month shows negative cash, you know exactly how far in advance to arrange financing or adjust spending.
Key inputs:
- Revenue forecast: Base on trailing 3-month trend plus seasonality adjustments. Conservative is better than optimistic for cash planning.
- Inventory purchases: Based on 60 to 90 day forward demand forecast plus safety stock. This is typically the largest cash outflow.
- Marketing budget: 15 to 25% of projected revenue for paid acquisition. Adjust monthly based on CAC and ROAS targets. For CAC depth, see our customer acquisition cost guide.
- Fixed costs: Rent, payroll, software subscriptions, insurance. These grow in steps as you scale (hiring a new employee, expanding warehouse).
- Variable costs: Shipping, packaging, payment processing fees, marketplace commissions. These scale proportionally with revenue.
Model 2: Unit economics per product
A per-unit breakdown showing whether each product is actually profitable after all costs:
| Line Item | Example ($40 product) | % of Revenue |
|---|---|---|
| Selling price | $40.00 | 100% |
| Product cost (COGS) | ($12.00) | 30% |
| Shipping cost | ($5.50) | 14% |
| Marketplace/platform fees | ($4.00) | 10% |
| Payment processing | ($1.46) | 4% |
| Packaging | ($1.00) | 3% |
| Gross profit | $16.04 | 40% |
| Marketing cost per unit (at target CAC) | ($8.00) | 20% |
| Contribution margin | $8.04 | 20% |
Products with contribution margin below 15% are candidates for price increases, cost reduction, or discontinuation. Products above 25% are your scaling priorities: they fund growth. Use our profit margin calculator for quick per-product analysis.
Model 3: Scenario planning
For major investments (new product launch, warehouse lease, hiring, large inventory order), model three scenarios:
- Best case: 20% above target. Revenue grows faster than projected, inventory turns quickly, marketing CPA decreases.
- Base case: Target performance. Most likely outcome based on historical data and conservative projections.
- Worst case: 30% below target. Revenue underperforms, inventory takes longer to sell, marketing CPA increases.
If the worst case doesn’t bankrupt the business or require emergency financing, the investment is sized appropriately. If worst case creates a cash crisis, reduce the investment size until worst case is survivable.
How Do I Budget Inventory for Growth?
The inventory investment formula
Inventory budget = (Projected monthly unit sales x Target months of stock x Unit cost) + Safety stock buffer
Example: 500 units/month projected x 3 months of stock x $12/unit cost + 20% safety buffer = $21,600 inventory investment for one SKU. Across 10 SKUs, that’s $100,000 to $250,000 in inventory capital for a business doing $20,000 to $40,000/month.
Inventory budgeting rules for scaling
- Carry 60 to 90 days of inventory: Under 45 days risks stockouts during demand spikes. Over 120 days ties up too much cash and risks obsolescence.
- Weight inventory investment by product velocity: Top 20% of products (by revenue) deserve 60 to 70% of inventory budget. Don’t spread capital equally across slow-moving and fast-moving SKUs.
- Pre-fund seasonal inventory 90 to 120 days before peak: Holiday inventory should be ordered by August. Waiting until October risks supplier delays and expedited shipping costs that eat margin. For inventory management depth, see our inventory management guide.
How Should I Allocate Marketing Budget While Scaling?
Marketing budget as a percentage of revenue
| Revenue Stage | Marketing Budget % | Focus |
|---|---|---|
| $0 to $10k/month | 25 to 35% | Testing channels, finding product-market fit |
| $10k to $50k/month | 20 to 25% | Scaling winning channels, adding email/SMS |
| $50k to $200k/month | 15 to 20% | Optimizing efficiency, organic growth investment |
| $200k+/month | 12 to 18% | Diversification, brand building, retention focus |
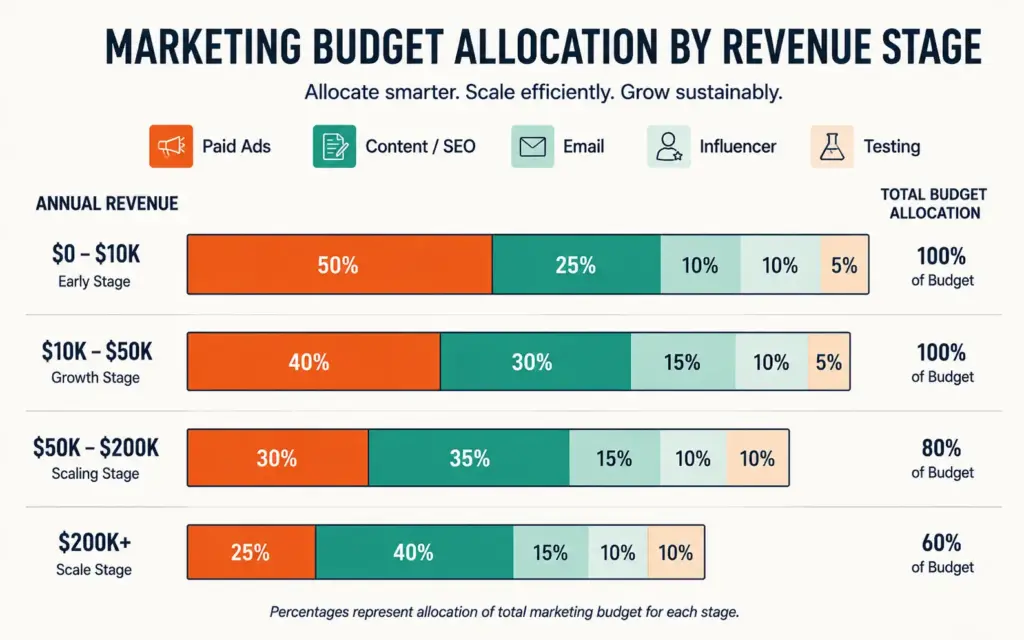
Marketing budget percentage decreases as revenue grows because organic channels (SEO, content, email, word-of-mouth) contribute a growing share. For marketing strategy depth, see our content marketing guide and our Facebook ads guide.
Channel allocation within marketing budget
- Paid acquisition (Meta, Google, TikTok): 50 to 65% of marketing budget
- Content and SEO: 15 to 20% (writer, tools, production)
- Email and SMS: 5 to 10% (platform cost, design)
- Influencer and partnerships: 5 to 15% (creator payments, affiliate commissions)
- Testing and experimentation: 5 to 10% (new channels, new creative, A/B testing)
What Growth Financing Options Exist for Ecommerce?
Revenue-based financing
Lenders (Clearco, Wayflyer, Shopify Capital) advance capital based on your revenue history and repay through a fixed percentage of daily sales (typically 6 to 12% of daily revenue until repaid). No equity dilution. Factor cost runs 6 to 12% of the advance amount. Best for inventory purchases with predictable payback periods of 3 to 6 months.
Business lines of credit
Banks and fintech lenders offer revolving credit lines ($25,000 to $500,000) that you draw against as needed. Interest rates: 8 to 20% APR depending on creditworthiness. Best for bridging cash flow gaps and seasonal inventory needs. Only borrow what you can repay from projected revenue within 6 months.
Supplier payment terms
Negotiating Net 30, Net 60, or Net 90 payment terms with suppliers extends your cash runway without borrowing. Most suppliers offer terms once you’ve established a 3 to 6 month purchase history with consistent volume. Net 60 terms on $30,000 monthly inventory purchases effectively loans you $60,000 in working capital at zero interest.
When equity financing makes sense
Venture capital or angel investment makes sense only when the growth opportunity requires capital beyond what revenue and debt can fund, and you’re willing to trade ownership for speed. Most ecommerce businesses scale to $1M to $5M annual revenue without equity investment using revenue-based financing and supplier terms. According to Clearco’s ecommerce funding guide, revenue-based financing has grown 300% since 2020 as the preferred non-dilutive capital source for DTC brands. For startup cost planning, see our ecommerce startup costs guide.
Common Financial Planning Mistakes
Growing revenue faster than cash supports
Doubling from $50k to $100k/month requires $50k to $150k in additional working capital for inventory and operations. Without that capital planned in advance, you stock out on best-sellers, delay marketing spend, and miss the growth window. Plan capital needs 90 days ahead of projected growth.
Not tracking unit economics by product
Blended margins mask individual product problems. A store with 40% blended margin might have 5 products at 60% margin subsidizing 3 products at negative margin. Without per-product unit economics, you scale the wrong products and wonder why profit doesn’t grow with revenue.
Spending on growth before achieving product-market fit
Scaling marketing spend on a product with 5% conversion rate and 20% return rate amplifies a broken foundation. Fix conversion and product quality first, then scale. Marketing spend should accelerate momentum, not create it. For conversion optimization, see our checkout optimization guide.
Confusing revenue with profit
A store doing $100k/month in revenue with 5% net margin generates $5,000/month in actual profit. A store doing $50k/month with 20% net margin generates $10,000/month. Revenue is vanity; profit is sanity. Build financial models on profit and cash flow, not topline revenue.
No emergency cash reserve
Maintain 2 to 3 months of fixed operating expenses in accessible cash. Supply chain disruptions, ad account bans, platform policy changes, and seasonal dips happen without warning. An emergency reserve prevents one bad month from cascading into a business failure. For broader operations resilience, see our ecommerce automation guide.
Frequently Asked Questions
Growth consumes cash before it generates cash. Every revenue increase requires upfront investment in inventory, marketing, and operations paid weeks or months before customer payments arrive. A business doubling monthly revenue from $50k to $100k needs $50k to $150k in additional working capital. Without pre-planning, the cash gap between investment and revenue collection creates a crisis during the best growth period.
The cash conversion cycle measures days between paying for inventory and collecting customer payment. Formula: days inventory outstanding plus days sales outstanding minus days payable outstanding. A 60-day CCC means every dollar of inventory investment is locked up for 60 days. DTC ecommerce typically has 30 to 90 day CCC depending on inventory holding time and supplier payment terms. Shortening CCC by 15 days can free $50,000+ in working capital for a $1M business.
Allocate 25 to 35% of revenue at the $0 to $10k/month stage (testing and finding channels), 20 to 25% at $10k to $50k/month (scaling winners), 15 to 20% at $50k to $200k/month (optimizing and building organic), and 12 to 18% at $200k+/month (brand and retention). The percentage decreases as organic channels grow and contribute a larger revenue share, reducing dependence on paid acquisition.
Revenue-based financing (RBF) advances capital based on your revenue history, repaid through a fixed percentage (6 to 12%) of daily sales until the advance plus a factor fee (6 to 12%) is repaid. Providers include Clearco, Wayflyer, and Shopify Capital. No equity dilution. Best for inventory purchases with 3 to 6 month payback periods. RBF is typically available once you have 6+ months of revenue history above $10k/month.
Carry 60 to 90 days of projected demand plus a 20% safety stock buffer. Under 45 days risks stockouts during demand spikes or supplier delays. Over 120 days ties up too much cash and creates obsolescence risk. Weight inventory investment by product velocity: your top 20% of products by revenue should receive 60 to 70% of inventory budget. Pre-fund seasonal inventory 90 to 120 days before peak periods.
Yes, once revenue exceeds $50k/year. Below that, accounting software (QuickBooks, Xero) handles most needs. Above $50k, a bookkeeper ($200 to $500/month) maintains accurate records. Above $200k annual revenue, a CPA ($300 to $800/month) handles tax planning, sales tax compliance, and financial strategy. The cost of professional accounting is almost always repaid through tax savings and financial visibility alone.
Related Reads
- Ecommerce Profit Margins
- Inventory Management Guide
- Ecommerce Automation
- Customer Acquisition Cost
- Ecommerce Startup Costs
- Checkout Optimization
Enjoying this? Get more like it every week.
One email per week with ecommerce strategies, tool picks, and seller insights. No spam.