- Warehouse optimization is the systematic improvement of layout, slotting, pick paths, equipment, and labor process to reduce cost per order and accelerate fulfillment. Mid-sized ecommerce warehouses typically reduce cost per order 20 to 40% through optimization without capital investment in automation.
- The 80/20 rule dominates ecommerce warehousing: roughly 20% of SKUs drive 80% of order volume. Slotting fast-movers in the most accessible locations and grouping commonly co-ordered SKUs reduces pick travel time 30 to 50%.
- The four highest-ROI optimization layers are slotting (which SKU goes where), pick path design (the sequence pickers walk), wave planning (batching orders), and zone strategy (specialist vs generalist picker assignments).
- Warehouse automation (conveyor systems, robotic picking, AS/RS) pays back when volume exceeds 1,000 to 2,000 orders per day. Below that threshold, process optimization outperforms capital investment.
Warehouse optimization is the systematic improvement of layout, slotting, pick paths, equipment, and labor process to reduce cost per order and accelerate fulfillment. For mid-sized ecommerce warehouses, well-executed optimization typically reduces cost per order 20 to 40% without capital investment in automation. The work is unglamorous: rearranging shelves, mapping walk patterns, and rewriting pick sequences. The result is the operational edge that lets stores absorb the rising cost of customer acquisition without raising prices.
The math is decisive. Labor accounts for roughly 60 to 65% of warehouse operating cost in standard ecommerce fulfillment. Within labor, picking represents 50 to 60% of total time. A 20% reduction in pick time directly cuts roughly 6 to 8% of total warehouse cost. At even modest order volumes (500 to 2,000 orders per day), the dollar impact compounds quickly. For broader operations context, see our inventory management guide.
This guide covers the 12 highest-ROI warehouse optimization tactics, when to invest in technology vs process improvement, the specific metrics that diagnose warehouse problems, and the operational changes that separate efficient ecommerce operations from those losing margin to fulfillment cost.
The Four Layers of Warehouse Optimization
Before tactical changes, understand the structure. Ecommerce warehouse optimization operates on four interdependent layers, each addressed in sequence:
- Slotting: Which SKU goes in which physical location
- Pick path: The sequence pickers walk to gather orders
- Wave planning: How orders are batched and released to the floor
- Zone strategy: Whether pickers cover the entire warehouse or specialized zones
Each layer compounds. Optimal slotting wasted by inefficient pick paths returns minimal gains. Excellent pick paths in a wave plan that batches incompatible orders performs worse than basic single-order pulls. Optimize in order, not in parallel.
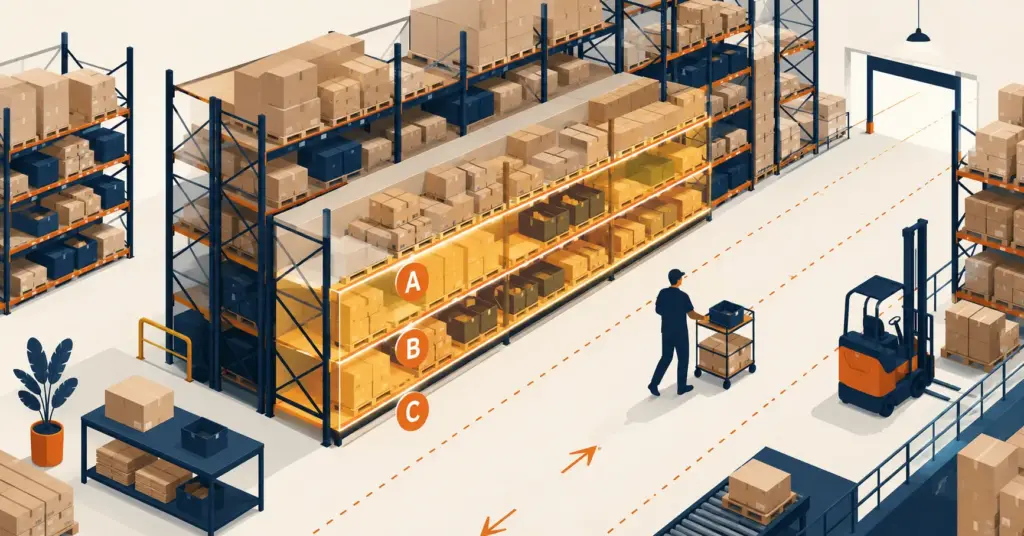
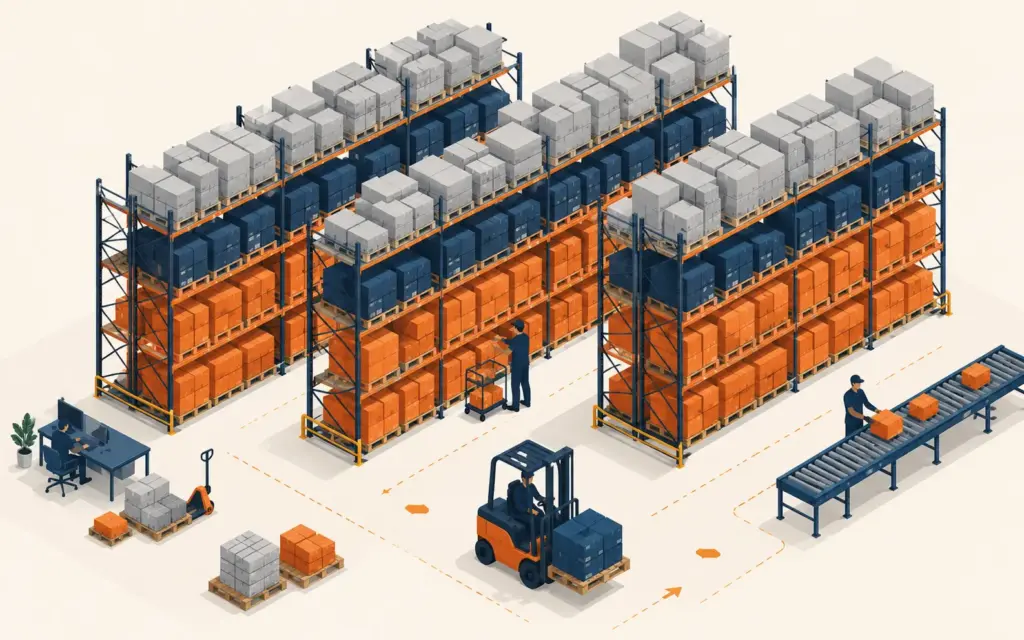
Layer 1: Slotting (The Highest-Impact Lever)
Slotting determines where each SKU lives in the warehouse. The wrong slotting strategy wastes 30 to 50% of pick time on unnecessary walking and reaching. The right strategy aligns physical location to order velocity, weight, and co-pick patterns.
The ABC velocity classification
Sort SKUs by 90-day order volume:
- A items (top 10 to 15% of SKUs, 60 to 70% of order volume): Golden zone slotting at waist-to-shoulder height, near packing stations
- B items (next 25 to 30% of SKUs, 20 to 25% of volume): Standard rack locations, easily accessible
- C items (bottom 55 to 65% of SKUs, 5 to 15% of volume): High shelves, far from pack stations, or smaller bin locations
Re-slot quarterly. SKU velocity shifts with seasons, new product launches, and pricing changes. Warehouses that slot once at setup and never revisit lose 8 to 15% in pick efficiency within 12 months.
Co-pick analysis
Run order history to find SKUs that appear together frequently. If items A and B appear in the same order 30%+ of the time, slot them adjacent. Multi-item orders become single-stop picks rather than warehouse traversals. For mid-sized operations, even simple Excel analysis of “products commonly bought together” reveals 5 to 20 adjacency opportunities that meaningfully cut pick time.
Weight and size considerations
Heavy items go on the bottom (safety, ergonomics, building order picker boxes from the bottom up). Fragile items get protected slotting (away from heavy traffic, lower shelves). Oversized items live in dedicated zones rather than mixed with small parts.
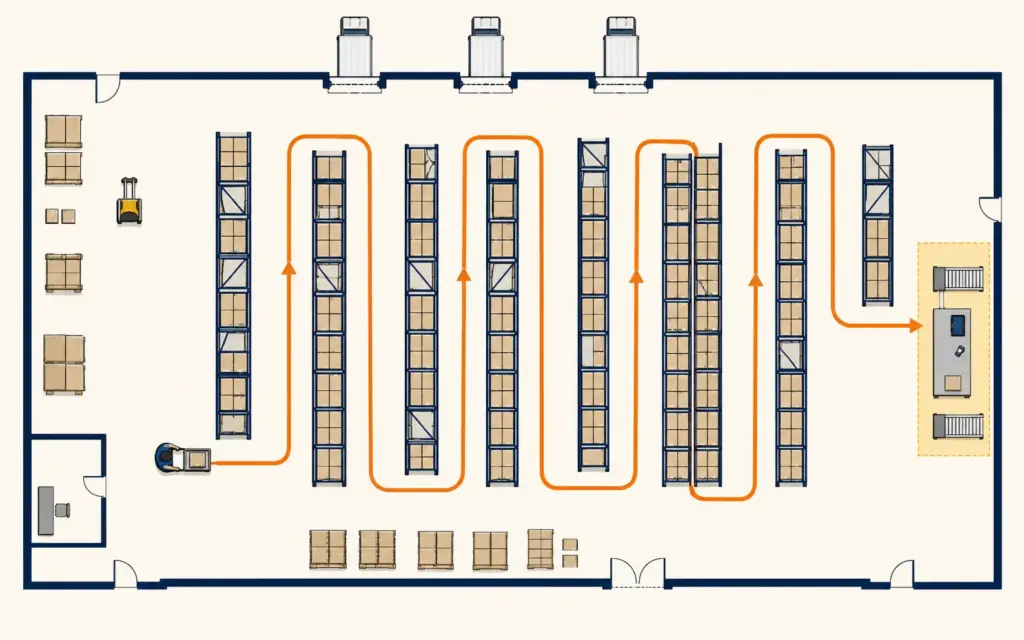
Layer 2: Pick Path Design
The pick path is the sequence pickers walk to gather all items in an order. Two warehouses with identical slotting can have 40% different pick times based purely on path design.
Serpentine vs S-shape paths
For traditional rack layouts with parallel aisles, serpentine routing (zigzag pattern) typically outperforms return-to-center or random walking. The picker enters aisle 1, walks to the end, returns through aisle 2, and so on. The path adds slight walk distance but eliminates the cognitive overhead of deciding which aisle to enter next.
Walk distance metric
Track average walk distance per order. Benchmarks for typical ecommerce operations:
- Excellent: Under 200 feet per single-item order, under 350 feet per multi-item order
- Acceptable: 200 to 350 feet single-item, 350 to 600 feet multi-item
- Needs work: Above 350 feet single-item, above 600 feet multi-item
Stores tracking walk distance for the first time often discover average paths 2 to 3x their theoretical optimum, indicating significant pick path or slotting issues.
Pick path software
WMS (warehouse management system) software with optimization modules generates routes by sequencing pick locations algorithmically. Mid-sized operations using Veeqo, ShipBob, or NetSuite WMS see 15 to 30% reductions in walk time after adopting algorithmic pick path generation. For under 500 orders per day, manual route design plus serpentine discipline often performs comparably.
Layer 3: Wave Planning and Batch Picking
Single-order picking (one picker grabs one order at a time) is the default but rarely optimal above 200 orders per day. Wave planning batches orders to reduce per-order pick time.
Wave types
- Single-order pick: One order per picker pass. Simple but slow. Right for: low volume, complex orders, oversized items.
- Batch picking: Picker collects items for 5 to 20 orders simultaneously, sorts to orders at pack station. Right for: high small-item volume, similar order profiles.
- Zone picking: Orders pass between pickers responsible for specific zones, each grabbing only items in their zone. Right for: very large warehouses, specialized handling needs.
- Wave + zone hybrid: Batches of orders progress through zones, gathering items as they go. Right for: complex multi-thousand-order-per-day operations.
Batch size optimization
Larger batches reduce walk time per order but increase sort complexity at pack stations. Optimal batch size depends on order profile, picker training, and pack station capacity. Most ecommerce warehouses find their sweet spot at 8 to 12 orders per batch. Above 15, sort errors typically rise faster than pick efficiency gains.
Layer 4: Zone Strategy and Labor Allocation
Generalist vs specialist pickers
Generalist pickers cover the entire warehouse. They walk further but require minimal training and adapt to volume shifts. Specialist pickers cover specific zones. They walk less and develop muscle memory for fast picking in their area, but require more training and rigid scheduling.
Generalists work for under 1,000 orders per day. Specialists become advantageous above 2,000 orders per day. Between those volumes, hybrid models (specialists during peak hours, generalists during off-peak) typically outperform either pure approach.
Picker-to-pack-station ratio
Most warehouses run 4 to 6 pickers per pack station. Below 4 pickers per station, pack stations sit idle; above 6, pickers queue at packing. Track pack station utilization (orders per hour packed vs theoretical capacity) to identify imbalance. For broader fulfillment context, see our order fulfillment process guide.
Labor scheduling against order velocity
Pull 14-day order velocity data to schedule labor matched to actual demand. Most ecommerce warehouses see 30 to 50% volume variation between Monday and Sunday, with Tuesday through Thursday peak. Staffing flat through the week wastes 10 to 15% of labor cost during low-volume days.
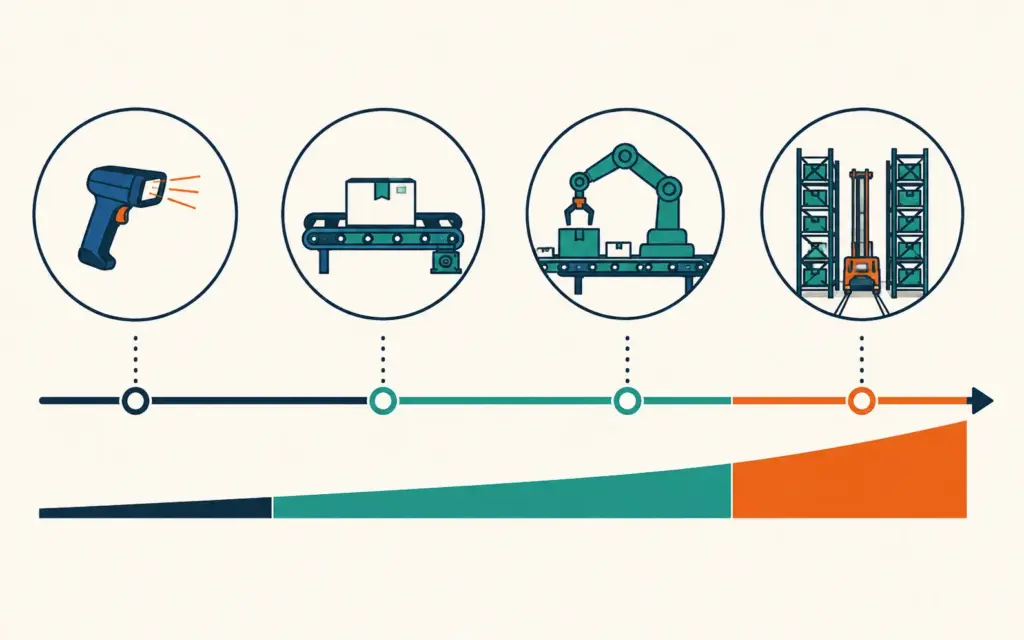
Equipment and Technology Decisions
When to invest in automation
Capital automation (conveyor systems, robotic picking, automated storage and retrieval, sortation) pays back at specific volume thresholds:
| Volume Threshold | Technology | Typical Payback |
|---|---|---|
| 500 orders/day | Handheld scanners + WMS | 6 to 12 months |
| 1,000 orders/day | Conveyor + put-to-light sortation | 18 to 30 months |
| 2,000 orders/day | Goods-to-person picking (Kiva-style) | 30 to 48 months |
| 5,000 orders/day | AS/RS + robotic picking | 36 to 60 months |
Below volume thresholds, automation rarely pays back. Process optimization (slotting, paths, waves) returns more per dollar invested for sub-1,000-order-per-day operations.
The case for handheld scanners
The single highest-ROI technology purchase for any warehouse above 100 orders per day is a barcode scanner and basic WMS. Scanning at pick reduces error rates from 1 to 3% (paper-based) to 0.1 to 0.3%. The reduction in returns, customer service load, and re-ship cost typically pays back scanner investment in under 6 months.
Cartonization software
Cartonization tools select the smallest viable box for each order based on product dimensions. Reduces dimensional weight charges 10 to 20% on average and cuts packing material cost 8 to 15%. Worth investigating once monthly shipping spend exceeds $20,000.
Metrics That Diagnose Warehouse Problems
Warehouse optimization without measurement is guessing. Track these metrics monthly:
Productivity metrics
- Units picked per hour: Benchmark 60 to 120 units/hour depending on order profile
- Orders shipped per labor hour: Benchmark 8 to 25 orders/hour depending on average units per order
- Pick error rate: Target below 0.5%, excellent below 0.2%
- Cost per order shipped: Track all-in labor + materials + overhead. Benchmark $3 to $8 for sub-1,000 order/day operations
Quality metrics
- Order accuracy rate: Target above 99.5%
- On-time ship rate: Target above 98% within stated SLA
- Damage rate: Target below 0.2% of orders
- Returns due to wrong item: Target below 0.3% of orders
Inventory metrics
- Inventory accuracy: Target 99%+ when cycle counted
- Stockout rate: Target below 2%
- Days of inventory on hand: Target 30 to 60 days for fast-movers, 60 to 120 days for slow-movers
- Slotting compliance: Percentage of SKUs in their designated locations. Target above 95%
Common Warehouse Optimization Mistakes
Optimizing without measuring baseline
Stores that reorganize layout without measuring current pick time, walk distance, and error rate cannot validate whether changes helped or hurt. Spend the first 2 weeks measuring before changing anything. The data also reveals which changes will have the biggest impact.
Buying automation before fixing process
Automation amplifies whatever process it runs. Inefficient slotting plus conveyor automation produces inefficient picks faster. Optimize process first, then automate. Most warehouses see 30 to 50% improvement from process changes alone, often eliminating the immediate need for capital automation.
Slotting once and forgetting
SKU velocity changes constantly. Quarterly re-slotting is the minimum cadence; monthly is better for high-velocity operations. Static slotting loses 8 to 15% efficiency annually as the catalog shifts beneath it.
Ignoring picker feedback
The people actually doing the picking know which slotting decisions, pick paths, and equipment choices waste their time. Quarterly feedback sessions with pickers surface optimization opportunities that data alone misses. Their suggestions also improve morale and retention, both of which matter operationally.
Skipping standard work documentation
Warehouse processes that exist only in tribal knowledge break every time a picker leaves. Document standard pick sequences, pack procedures, and exception handling. Cross-training becomes faster and quality more consistent when work is documented rather than learned through apprenticeship. For broader process design, see our SOP and process design guide.
Frequently Asked Questions
Warehouse optimization is the systematic improvement of layout, slotting, pick paths, equipment, and labor process to reduce cost per order and accelerate fulfillment. For mid-sized ecommerce warehouses, well-executed optimization typically reduces cost per order 20 to 40% without capital investment in automation. The four layers are slotting (which SKU goes where), pick path design (the walk sequence), wave planning (order batching), and zone strategy (picker assignment).
Start with serpentine routing through parallel aisles (zigzag pattern). Slot the top 10 to 15% of SKUs by velocity in waist-to-shoulder height locations near pack stations (the “golden zone”). Use a WMS with algorithmic route generation for warehouses above 500 orders per day. Track average walk distance per order and target under 200 feet for single-item orders, under 350 feet for multi-item orders.
Handheld scanners pay back at 100 orders per day. Conveyor systems and sortation pay back at roughly 1,000 orders per day. Goods-to-person robotic systems become viable above 2,000 orders per day. Full automated storage and retrieval requires 5,000+ orders per day to justify capital expense. Below volume thresholds, process optimization (slotting, paths, waves) returns more per dollar than automation.
ABC slotting classifies SKUs by order velocity. A items are the top 10 to 15% of SKUs that drive 60 to 70% of order volume; they go in golden zone locations (waist-to-shoulder height, near pack stations). B items are the next 25 to 30% of SKUs and get standard easily-accessible rack locations. C items are the slow-movers (bottom 55 to 65% of SKUs) and live on high shelves or smaller bins far from pack stations.
Quarterly is the minimum cadence for ecommerce warehouses. Monthly is better for high-velocity operations or stores with frequent new product launches. SKU velocity shifts with seasons, pricing changes, and catalog updates. Warehouses that slot once at setup and never revisit lose 8 to 15% in pick efficiency within 12 months.
Benchmark cost per order shipped (all-in labor + materials + overhead) at $3 to $8 for sub-1,000-order-per-day operations. Above $8 typically signals optimization opportunity in slotting, pick paths, or technology. Below $3 is rare and usually indicates either highly automated operations or specialized small-parts categories. Compare against your average order revenue to see fulfillment cost as a percent of revenue, with 6 to 12% being healthy for most categories.
Related Reads
- Order Fulfillment Process Guide
- Inventory Management Guide
- 3PL vs Self-Fulfillment Comparison
- Ecommerce Shipping Strategy
- SOP and Process Design
- Customer Acquisition Cost Guide
- Ecommerce Startup Costs
Enjoying this? Get more like it every week.
One email per week with ecommerce strategies, tool picks, and seller insights. No spam.